

Supply Chain Management and Logistics Blog. Posts are about end-to-end supply chain management and logistics in a time of challenging disruption. Tom provides leading supply chain management and logistics consulting and advisory assistance based on real-world experience. He brings authority and domain expertise to clients. Email Tom at: tomc@ltdmgmt.com Check Tom's profile at: https://www.linkedin.com/in/tomcraig1/
Thursday, March 5, 2015

GLOBAL VALUE CHAINS,ECONOMY, WEF
Why global value chains benefit the domestic economy
The growth of global value chains (GVCs) in the recent two decades has been one of the central developments in international trade. As coordination costs and trade costs continue to fall, it has become increasingly attractive for firms to offshore certain stages of their production. This, in turn, has led to the formation of regional and global production networks, which become manifest in a quickly expanding trade in intermediates and a rising foreign value-added content of exports (Johnson and Noguera 2012). Figure 1 illustrates this development for the years 1995 to 2008.
Figure 1. The rise of GVCs

Source: Author’s calculations based on OECD Inter-Country Input-Output tables.
In the beginning of this so-called global value chains revolution, both policymakers and academics praised the growth and development opportunities that they offer to low- and middle-income countries. These countries are released from the need to build whole supply chains domestically in order to industrialise. Instead, they can more easily join existing supply chains and specialise in specific tasks according to their technological capabilities (e.g. Baldwin 2012, OECD 2013, and UNCTAD 2013).
It has not taken long though for opponents of such an optimistic view on GVCs to arise. Their concern is that such chains are just a new way to push for old liberal trade policies that give developed countries free access to developing markets (Dalle et al. 2013). There is also the possibility that developing countries might fall in the middle-income trap being stuck in low value-added activities (UNCTAD 2013). Similarly, policymakers in high-income countries are driven by the fear that manufacturing jobs move abroad.
New evidence using extensive input-output data
New research shows now that GVCs can and do benefit the domestic economy if a set of prerequisites is fulfilled. Using a new unique set of inter-country input-output with extensive country coverage provided by the OECD, I find a positive and robust relationship between global value chains participation and domestic value-added (Kummritz 2014). This finding holds for indicators based on both backward linkages (i.e. foreign value-added in domestic exports) and forward linkages (i.e. domestic value-added in foreign exports) reflecting different stages of the value chain.
The result fits well with the growing theoretical work on GVCs and their impact on the domestic economy (e.g. Li and Liu 2014, Baldwin and Robert-Nicoud 2014, and Zi 2014). This literature analyses GVCs that are set up between a technologically less sophisticated low-wage country (‘south’) and a high-tech high-wage country (‘north’). The differences between the two countries make offshoring profitable by combining northern technology with southern wages. This, in turn, leads to benefits and losses for the two countries. The primary sources of gains for north are productivity improvements akin to technological change caused by lower costs and increased specialisation. South, on the other hand, profits through technology upgrading and increased specialisation, which leads to positive terms of trade effects and spillovers.
However, the new empirical evidence reveals one additional fact that is not explained by theory. More specifically, it shows that the positive effect of global value chains on domestic value-added is statistically significant for middle- and high-income countries only. Deriving novel source/using country-specific indicators for GVCs participation, I present evidence on theoretical transmission channels between the global chains and domestic value-added that explain these results. In particular, there is support for productivity enhancing effects through cost savings when richer countries source from low-wage countries. In contrast, there is only little evidence on gains through technology upgrading for low- and middle-income countries. Additional tests suggest that sufficient levels of absorptive capacity are necessary for such technology transfer effects to arise. Especially, human capital and legal institutions prove to be elementary factors for positive spillover effects into the domestic economy. Since absorptive capacity levels tend to be negligible in many low-income countries, the missing gains of GVCs participation for these countries on average can be easily explained.
Policy options
These new findings lead to two conclusions for policymakers.
Figure 1. The rise of GVCs
Source: Author’s calculations based on OECD Inter-Country Input-Output tables.
In the beginning of this so-called global value chains revolution, both policymakers and academics praised the growth and development opportunities that they offer to low- and middle-income countries. These countries are released from the need to build whole supply chains domestically in order to industrialise. Instead, they can more easily join existing supply chains and specialise in specific tasks according to their technological capabilities (e.g. Baldwin 2012, OECD 2013, and UNCTAD 2013).
It has not taken long though for opponents of such an optimistic view on GVCs to arise. Their concern is that such chains are just a new way to push for old liberal trade policies that give developed countries free access to developing markets (Dalle et al. 2013). There is also the possibility that developing countries might fall in the middle-income trap being stuck in low value-added activities (UNCTAD 2013). Similarly, policymakers in high-income countries are driven by the fear that manufacturing jobs move abroad.
New evidence using extensive input-output data
New research shows now that GVCs can and do benefit the domestic economy if a set of prerequisites is fulfilled. Using a new unique set of inter-country input-output with extensive country coverage provided by the OECD, I find a positive and robust relationship between global value chains participation and domestic value-added (Kummritz 2014). This finding holds for indicators based on both backward linkages (i.e. foreign value-added in domestic exports) and forward linkages (i.e. domestic value-added in foreign exports) reflecting different stages of the value chain.
The result fits well with the growing theoretical work on GVCs and their impact on the domestic economy (e.g. Li and Liu 2014, Baldwin and Robert-Nicoud 2014, and Zi 2014). This literature analyses GVCs that are set up between a technologically less sophisticated low-wage country (‘south’) and a high-tech high-wage country (‘north’). The differences between the two countries make offshoring profitable by combining northern technology with southern wages. This, in turn, leads to benefits and losses for the two countries. The primary sources of gains for north are productivity improvements akin to technological change caused by lower costs and increased specialisation. South, on the other hand, profits through technology upgrading and increased specialisation, which leads to positive terms of trade effects and spillovers.
However, the new empirical evidence reveals one additional fact that is not explained by theory. More specifically, it shows that the positive effect of global value chains on domestic value-added is statistically significant for middle- and high-income countries only. Deriving novel source/using country-specific indicators for GVCs participation, I present evidence on theoretical transmission channels between the global chains and domestic value-added that explain these results. In particular, there is support for productivity enhancing effects through cost savings when richer countries source from low-wage countries. In contrast, there is only little evidence on gains through technology upgrading for low- and middle-income countries. Additional tests suggest that sufficient levels of absorptive capacity are necessary for such technology transfer effects to arise. Especially, human capital and legal institutions prove to be elementary factors for positive spillover effects into the domestic economy. Since absorptive capacity levels tend to be negligible in many low-income countries, the missing gains of GVCs participation for these countries on average can be easily explained.
Policy options
These new findings lead to two conclusions for policymakers.
- Firstly, integrating into GVCs is a sound strategy. Interacting with global production networks can improve productivity and lead to spillovers for the domestic economy, as successfully shown by a large set of middle-income countries (e.g. Czech Republic, South Korea).
- Secondly, the materialisation of these gains is not guaranteed. New entrants need to ensure that they have a good institutional environment that incentivises foreign firms to source inputs locally and to outsource a growing share of their production.
TRADE, TRANSPORT COSTS, WEF
Do transport costs still matter?
By Kristian Behrens and Théophile Bougna
Transport and communication costs fell precipitously during the last century (see Glaeser and Kohlhase, 2004), leading many observers to posit that the world has ‘become flat’, that locational differences no longer matter (Cairncross, 1991). With the help of cheap transport and communication, business can be done almost anywhere, or so the story goes, leaving policymakers with the impression that we have entered ‘brave new frictionless’ world. But, if this were true, the costs of trading and transporting goods should no longer have much bearing on firms’ location choices and, thereby, the spatial structure of economic activity.
Changes in the costs of trading goods across space affect the concentration patterns, especially at short distances. This suggests that the micro-geographic structure of an economy—the clustering of firms in industries at a short distance—is influenced by changes in the trading environment
This debate about the magnitude of transport costs and their importance for economic outcomes may be viewed as a particular instance of the more general fallacy that consists of equating ‘low’ with ‘unimportant’.1 On two counts, the empirical evidence challenges this fallacy.
This is the question we ask in our recent work (Behrens et al. 2015). We use detailed microgeographic manufacturing data for Canada from 1990 to 2008 to document changes in patterns of geographical specialisation. We study how those changes are related to:
To establish that result, we first measure the geographical concentration of manufacturing industries in Canada and document changes in that concentration. We find that the extent of geographical concentration has declined from 1990 to 2008 (see also Behrens and Bougna, 2015). For the ten most concentrated industries in Canada, on average, about 35% of plants in 1990 were located less than 50 kilometers from each other, but by 2008 that figure had dropped to 21%. Although changes are less pronounced when concentration is measured in terms of either employment or sales—thus showing that clustering is partly driven by bigger and more productive firms—there is nevertheless a clear downward trend.
While these results suggest the world has become flatter, we show that this trend is associated with changes in the costs of trading goods across space. To illustrate this, Figures 1 and 2 below—which depict the coefficient estimates and 95% confidence bands for the impact of trucking costs and of the Asian share of imports on the measures of geographical concentration in Canada—show that the spatial effects of transport costs and Asian imports affect location patterns in a systematic way.2As can be seen, the effects are especially strong at short geographical distances (less than 100 kilometer). In a nutshell, changes in the costs of trading goods across space affect the concentration patterns, especially at short distances. This suggests that the micro-geographic structure of an economy—the clustering of firms in industries at a short distance—is influenced by changes in the trading environment. Of course, the obvious next question is how strongly.
Figure 1. Coefficient estimates for the impacts of trucking costs on the geographical concentration of manufacturing industries in Canada, 1990-2008

Figure 2. Coefficient estimates for the impacts of the Asian share of imports on the geographical concentration of manufacturing industries in Canada, 1990-2008

We find that if imports from low cost Asian countries had remained at their 1992 levels in Canada, the geographical concentration of industries would have, on average, decreased by 60% less (or about 9 percentage points). The corresponding figure for changes in trucking costs is 20% (or 5 percentage points). Had trucking costs not decreased between 1992 and 2008, we would have observed more geographical dispersion. Table 1 summarises our results and reveals that changes in transport costs, in import exposure, and in access to clients and suppliers all have a sizable effect on changes in location patterns.
Table 1. Counterfactual changes in geographic concentration holding measures of trade costs constant

With this evidence in hand, the key message of our findings is that changes in the geographical concentration of industries due to changes in transport costs, in international trade exposure, and in access to clients and suppliers are all large. The world may be getting flatter, but we are not yet quite there. The lesson for policy makers is that small changes in trade costs—stemming from trade agreements—or in transport costs—due to infrastructure projects—or in any other policy that changes the costs of trading goods across nations and regions, still impact the economic geography of industries. They may impact them especially strongly in a world where firms compete globally and where any locational advantage drives profit margins—and thus locational incentives—to a sizable extent.
Changes in the costs of trading goods across space affect the concentration patterns, especially at short distances. This suggests that the micro-geographic structure of an economy—the clustering of firms in industries at a short distance—is influenced by changes in the trading environment
This debate about the magnitude of transport costs and their importance for economic outcomes may be viewed as a particular instance of the more general fallacy that consists of equating ‘low’ with ‘unimportant’.1 On two counts, the empirical evidence challenges this fallacy.
- First, the tendency for economic activity to cluster in space is still strong. Many industries nowadays do exhibit strong location patterns, including for the entry of new firms that should face little locational constraints.
- Second, and contrary to popular belief, it has been documented that trade costs—broadly defined—remain large. Anderson and van Wincoop (2004), for example, estimate that trade costs amount to a tariff equivalent of 117%, a large number by any metric.
This is the question we ask in our recent work (Behrens et al. 2015). We use detailed microgeographic manufacturing data for Canada from 1990 to 2008 to document changes in patterns of geographical specialisation. We study how those changes are related to:
- Changes in the costs of shipping goods across space,
- Exposure to international trade, and
- Shifting landscapes of access to domestic suppliers and clients.
To establish that result, we first measure the geographical concentration of manufacturing industries in Canada and document changes in that concentration. We find that the extent of geographical concentration has declined from 1990 to 2008 (see also Behrens and Bougna, 2015). For the ten most concentrated industries in Canada, on average, about 35% of plants in 1990 were located less than 50 kilometers from each other, but by 2008 that figure had dropped to 21%. Although changes are less pronounced when concentration is measured in terms of either employment or sales—thus showing that clustering is partly driven by bigger and more productive firms—there is nevertheless a clear downward trend.
While these results suggest the world has become flatter, we show that this trend is associated with changes in the costs of trading goods across space. To illustrate this, Figures 1 and 2 below—which depict the coefficient estimates and 95% confidence bands for the impact of trucking costs and of the Asian share of imports on the measures of geographical concentration in Canada—show that the spatial effects of transport costs and Asian imports affect location patterns in a systematic way.2As can be seen, the effects are especially strong at short geographical distances (less than 100 kilometer). In a nutshell, changes in the costs of trading goods across space affect the concentration patterns, especially at short distances. This suggests that the micro-geographic structure of an economy—the clustering of firms in industries at a short distance—is influenced by changes in the trading environment. Of course, the obvious next question is how strongly.
Figure 1. Coefficient estimates for the impacts of trucking costs on the geographical concentration of manufacturing industries in Canada, 1990-2008
Figure 2. Coefficient estimates for the impacts of the Asian share of imports on the geographical concentration of manufacturing industries in Canada, 1990-2008
We find that if imports from low cost Asian countries had remained at their 1992 levels in Canada, the geographical concentration of industries would have, on average, decreased by 60% less (or about 9 percentage points). The corresponding figure for changes in trucking costs is 20% (or 5 percentage points). Had trucking costs not decreased between 1992 and 2008, we would have observed more geographical dispersion. Table 1 summarises our results and reveals that changes in transport costs, in import exposure, and in access to clients and suppliers all have a sizable effect on changes in location patterns.
Table 1. Counterfactual changes in geographic concentration holding measures of trade costs constant
With this evidence in hand, the key message of our findings is that changes in the geographical concentration of industries due to changes in transport costs, in international trade exposure, and in access to clients and suppliers are all large. The world may be getting flatter, but we are not yet quite there. The lesson for policy makers is that small changes in trade costs—stemming from trade agreements—or in transport costs—due to infrastructure projects—or in any other policy that changes the costs of trading goods across nations and regions, still impact the economic geography of industries. They may impact them especially strongly in a world where firms compete globally and where any locational advantage drives profit margins—and thus locational incentives—to a sizable extent.
Wednesday, March 4, 2015
FDA, IMPORT FOOD SAFETY
I suspect there are holes in the import food supply chain and that the FDA could use LTD Management's global food supply chain risk model and methodology.
The Government Accountability Office reported to Congress recently that the Food and Drug Administration needs to take additional actions to help its foreign offices ensure the safety of imported food.
The report points out that the FDA is not inspecting the number of foreign food facilities required by the Food Safety Modernization Act. FSMA required the FDA to inspect at least 600 foreign food facilities in 2011 and to at least double the number of facilities inspected for each of the next five years. However, the FDA has not kept pace with this mandate and is planning to conduct only 1,200 foreign facility inspections through 2016. Agency officials have cited limited resources as the primary reason but have also questioned the usefulness of conducting the number of inspections required by law. However, the report states that the FDA has not conducted an analysis to determine how many inspections are sufficient to ensure the comparable safety of imported and domestic food and that without such an analysis the agency is not in a position to request a change in the mandate if appropriate.
FDA officials responding to the GAO report agreed with the recommendation to conduct this analysis and recognized that foreign inspections provide accountability for inspected firms, incentives for them to comply with U.S. import requirements and intelligence about foreign food safety practices. However, officials added that foreign inspections will not, in and of themselves, ensure the comparable safety of imported and domestic food and that the FDA is expanding its collaborations with foreign governments to assist in this goal.
The report also states that the FDA’s performance measures do not fully capture the contributions that foreign offices say they are making to the safety of imported food, five years after the GAO recommended the development of such measures. The FDA has initiated a review to determine how to better reflect the value of its foreign offices in the agency-wide performance systems but has not implemented new performance measures of determined when this review will be completed.
Finally, the report notes, the FDA has not followed through on a 2010 GAO recommendation to develop a strategic workforce plan to help ensure that it recruits and retains staff for its foreign offices with the necessary experience and skills. The GAO continues to believe that such a plan is critical to the FDA’s ability to address staffing challenges, especially since 44 percent of foreign office positions were vacant as of October 2014.
FDA Needs to Review Foreign Food Inspections, Performance of Overseas Offices, GAO Says
Thursday, March 05, 2015
Sandler, Travis & Rosenberg Trade Report
The report points out that the FDA is not inspecting the number of foreign food facilities required by the Food Safety Modernization Act. FSMA required the FDA to inspect at least 600 foreign food facilities in 2011 and to at least double the number of facilities inspected for each of the next five years. However, the FDA has not kept pace with this mandate and is planning to conduct only 1,200 foreign facility inspections through 2016. Agency officials have cited limited resources as the primary reason but have also questioned the usefulness of conducting the number of inspections required by law. However, the report states that the FDA has not conducted an analysis to determine how many inspections are sufficient to ensure the comparable safety of imported and domestic food and that without such an analysis the agency is not in a position to request a change in the mandate if appropriate.
FDA officials responding to the GAO report agreed with the recommendation to conduct this analysis and recognized that foreign inspections provide accountability for inspected firms, incentives for them to comply with U.S. import requirements and intelligence about foreign food safety practices. However, officials added that foreign inspections will not, in and of themselves, ensure the comparable safety of imported and domestic food and that the FDA is expanding its collaborations with foreign governments to assist in this goal.
The report also states that the FDA’s performance measures do not fully capture the contributions that foreign offices say they are making to the safety of imported food, five years after the GAO recommended the development of such measures. The FDA has initiated a review to determine how to better reflect the value of its foreign offices in the agency-wide performance systems but has not implemented new performance measures of determined when this review will be completed.
Finally, the report notes, the FDA has not followed through on a 2010 GAO recommendation to develop a strategic workforce plan to help ensure that it recruits and retains staff for its foreign offices with the necessary experience and skills. The GAO continues to believe that such a plan is critical to the FDA’s ability to address staffing challenges, especially since 44 percent of foreign office positions were vacant as of October 2014.
AMAZON, 3D PRINTING
Amazon--who else---looks at mobile 3D printing for e-commerce. Wow factor for supply chains.
 There is little doubt that some of the world’s largest corporations are investigating 3D printing as a means to both make and save money across the board. Amazon, for example, has slowly been inching its way into the space, partnering with several key companies, including Mixee Labs, to offer customizable 3D printed products to their customers.
As the world’s leading ecommerce provider, Amazon seems to stay ahead of the curve when it comes to selling us anything from printer paper to giant $1 million robots. Thus far, it appears as if the company’s decision to enter the 3D printing space has paid off, as they continue to expand the program in both scale and scope.
If you know much about Amazon, then you know that they obsess with getting products to consumers as fast as physically possible. In fact, they have recently launched One-Hour Delivery in Manhattan, and is pushing for delivery via drones. Usually though, the faster a product is shipped, the more money it will cost the company that is shipping it, and ultimately this comes back to the consumer. For example, Amazon needs to stock literally millions of products at warehouse hubs as close to their customers as possible. Warehouse space is not cheap, especially when considering the millions of square feet needed by a company like Amazon.
What if Amazon could avoid same of these storage costs and get items to users even faster with the use of new, rapidly advancing technologies like 3D printing? Well, that’s just what they are looking into.
Late last week United States Patent and Trademark Office published a patent filing by Amazon Technologies, Inc. which outlines a method of 3D printing on-demand within mobile manufacturing hubs. According to Amazon, such a setup could save the company time and money on several fronts.

By utilizing ‘mobile manufacturing apparatuses Amazon would be able to send an STL file to a mobile unit that’s closest to a customer, providing it with instructions to print out an item which was ordered. When the item has been completed, it could then be within miles of the customer who ordered it and quickly delivered or picked up.
The mobile hubs, according to the patent filing, would include a means to both additively and subtractively manufacture an item. This could include a number of different 3D printing technologies as well as CNC machining tools, which would ultimately reduce Amazon’s reliance on warehouse space as well as the robots and employees needed to sort through these stored items.
Of course every patent that’s filed does not materialize into an actual product or service, but as 3D printing technology continues to progress and competition for delivery speed picks up, this is certainly something I could see Amazon eventually putting to use. Now we just have to wait for the drones which 3D print items 10,000 feet above the earth and can deliver items within minutes.
Let us know your thoughts on this patent filing. Could such a 3D printing and delivery process actually work anytime soon? Discuss in the Amazon mobile 3D printing forum thread on 3DPB.com. Below is a quick visualization of what Amazon’s 3D printing process could look like.
Amazon Files Patent for Mobile 3D Printing Delivery Trucks
 There is little doubt that some of the world’s largest corporations are investigating 3D printing as a means to both make and save money across the board. Amazon, for example, has slowly been inching its way into the space, partnering with several key companies, including Mixee Labs, to offer customizable 3D printed products to their customers.
As the world’s leading ecommerce provider, Amazon seems to stay ahead of the curve when it comes to selling us anything from printer paper to giant $1 million robots. Thus far, it appears as if the company’s decision to enter the 3D printing space has paid off, as they continue to expand the program in both scale and scope.
If you know much about Amazon, then you know that they obsess with getting products to consumers as fast as physically possible. In fact, they have recently launched One-Hour Delivery in Manhattan, and is pushing for delivery via drones. Usually though, the faster a product is shipped, the more money it will cost the company that is shipping it, and ultimately this comes back to the consumer. For example, Amazon needs to stock literally millions of products at warehouse hubs as close to their customers as possible. Warehouse space is not cheap, especially when considering the millions of square feet needed by a company like Amazon.

What if Amazon could avoid same of these storage costs and get items to users even faster with the use of new, rapidly advancing technologies like 3D printing? Well, that’s just what they are looking into.
Late last week United States Patent and Trademark Office published a patent filing by Amazon Technologies, Inc. which outlines a method of 3D printing on-demand within mobile manufacturing hubs. According to Amazon, such a setup could save the company time and money on several fronts.
“The multiplicity of items offered may require the electronic marketplace owner/operator to maintain a large inventory requiring sufficient space to store the inventory,” states the filing. “An electronic marketplace may also face the challenge of time delays related to the process of finding the selected item among a large inventory. Increased space to store additional inventory may raise costs for the electronic marketplace. Additionally, time delays between receiving an order and shipping the item to the customer may reduce customer satisfaction and affect revenues generated. Accordingly, an electronic marketplace may find it desirable to decrease the amount of warehouse or inventory storage space needed, to reduce the amount of time consumed between receiving an order and delivering the item to the customer, or both.”
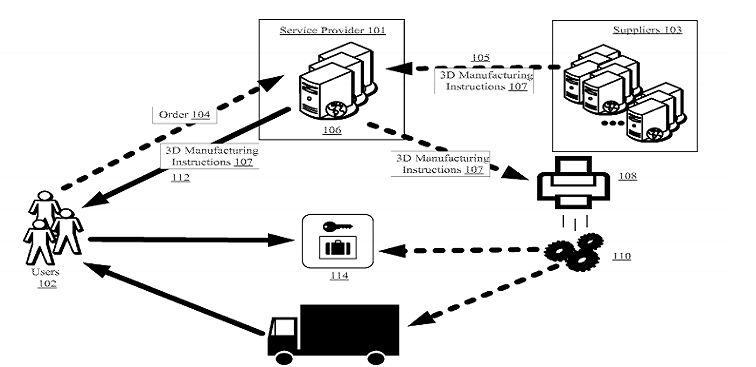
By utilizing ‘mobile manufacturing apparatuses Amazon would be able to send an STL file to a mobile unit that’s closest to a customer, providing it with instructions to print out an item which was ordered. When the item has been completed, it could then be within miles of the customer who ordered it and quickly delivered or picked up.
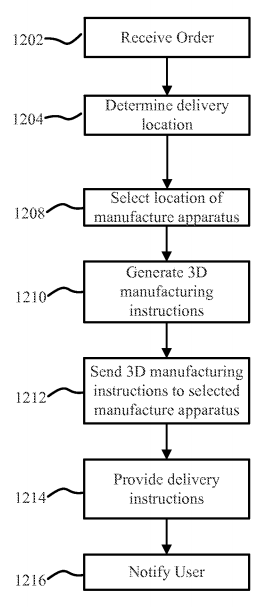
The mobile hubs, according to the patent filing, would include a means to both additively and subtractively manufacture an item. This could include a number of different 3D printing technologies as well as CNC machining tools, which would ultimately reduce Amazon’s reliance on warehouse space as well as the robots and employees needed to sort through these stored items.
Of course every patent that’s filed does not materialize into an actual product or service, but as 3D printing technology continues to progress and competition for delivery speed picks up, this is certainly something I could see Amazon eventually putting to use. Now we just have to wait for the drones which 3D print items 10,000 feet above the earth and can deliver items within minutes.
Let us know your thoughts on this patent filing. Could such a 3D printing and delivery process actually work anytime soon? Discuss in the Amazon mobile 3D printing forum thread on 3DPB.com. Below is a quick visualization of what Amazon’s 3D printing process could look like.
Tuesday, March 3, 2015
BLUE OCEAN STRATEGY USING SUPPLY CHAIN MANAGEMENT--Seminar in London
I will be doing two one-day seminars in London on 8 and 9 June.
9 June will be a discussion of Blue Ocean Strategy Using Supply Chain Management. Learn how to not be where everyone else is. Stop being in the red ocean where everyone else is.
Manufacturers, wholesalers, and retailers should attend. Learn about competitive differentiation, the new e-commerce, multichannel, and global--- all driven by blue ocean strategy using supply chain management.
Articles indicate that some freight firms do not understand the new e-commerce which is driven by the new supply chain. 3PLs and other logistics service providers should attend, to learn what their customers will be doing and to take ideas on what they can do to position themselves outside the commodity-service market they are in.
The 8 June seminar will be on Global Food Supply Chain Risk.
HERE IS A LINK FOR MORE INFORMATION--
http://www.complianceonline.com/global-food-supply-chain-risk-and-blue-ocean-strategy-seminar-training-80270SEM-prdsm

9 June will be a discussion of Blue Ocean Strategy Using Supply Chain Management. Learn how to not be where everyone else is. Stop being in the red ocean where everyone else is.
Manufacturers, wholesalers, and retailers should attend. Learn about competitive differentiation, the new e-commerce, multichannel, and global--- all driven by blue ocean strategy using supply chain management.
Articles indicate that some freight firms do not understand the new e-commerce which is driven by the new supply chain. 3PLs and other logistics service providers should attend, to learn what their customers will be doing and to take ideas on what they can do to position themselves outside the commodity-service market they are in.
The 8 June seminar will be on Global Food Supply Chain Risk.
HERE IS A LINK FOR MORE INFORMATION--
http://www.complianceonline.com/global-food-supply-chain-risk-and-blue-ocean-strategy-seminar-training-80270SEM-prdsm
TARGET, E-COMMERCE, BLUE OCEAN STRATEGY
Those retailers, manufacturers, and wholesalers who think e-commerce is having a website and shipping orders need to wake up. Get rid of your monolithic supply chain. Go Blue Ocean Strategy using Supply Chain Management.

CONTAINER LINES
Asset Rich, Cargo Poor--mantra of Container Lines. Excess capacity; suspect revenue management for too many. And it does not stop. Why?

CHINA, FREE-TRADE ZONES
FROM EIU--
China's new free-trade zones
In December 2014 the State Council (cabinet) announced that three new free-trade zones (FTZs), modelled on a similar zone established in Shanghai in 2013, would be created in Guangdong, Fujian and Tianjin. In contrast with most recently established and nationally prioritised zones, which were in western China, they are all situated on the prosperous eastern seaboard. It is too early to tell what impact they will have on their respective economies, but their designation may be more political than economic.
The FTZs, which will formally be established on March 1st, differ slightly from that in Shanghai in that they are not confined to a geographic part of one city. The Guangdong FTZ will include three cities in the province: the Nansha New Area in Guangzhou, the Qianhai and Shekou districts of Shenzhen, and Zhuhai's Hengqin New Area. The Tianjin FTZ will include the Tianjin Port Zone, the Tianjin Airport Economic Zone and the Binhai New Area. The Fujian FTZ will include the Pingtan Comprehensive Experimental Zone, parts of Xiamen (including the Xiangyu Bonded Zone), and parts of Fuzhou (including the Fuzhou Economic and Technological Development Zone).
At the same time, some tweaks were made to the Shanghai FTZ's geographic coverage. The zone, which currently sits near the airport, will be expanded to include the Lujiazui financial district, Jinqiao and the Zhanjiang High-tech zone. Progress in the Shanghai zone has been slow to date, which some have blamed on its location far from the city centre.
Development of the plans for these zones is still under way, but reports by local media in January suggest that the three new zones may have some similarities. "Negative lists", which were piloted in the Shanghai FTZ, are likely to be included. The negative list is a departure from how the government normally supervises foreign investment: under this approach, foreign investors should receive equal treatment to Chinese companies in any sector not explicitly restricted on the list. Guangdong is looking to encourage more investment from Hong Kong and Macau by eliminating or relaxing restrictions in a number of services sectors. Fujian FTZ will probably have similar offerings. According to local media, Pingtan, already designated a zone for cross-Strait co-operation, will also issue a negative list; in it, foreign investment in banking, securities and insurance will be subject to limitations, but Taiwan investors will be exempt. Tianjin plans to issue its own negative list as well, and has boasted that its list will be shorter than that of Shanghai.
Plans to ease customs clearances suggest that trade will continue to play a large role in these areas. In late January Tianjin's mayor discussed improving administrative effectiveness and easing custom clearance in Tianjin's port zone. Guangdong's FTZ encompasses Shekou, which hosts ports and logistics. Preferential policies in the area will include eased custom clearance procedures, too, to help raise the competitiveness of the Pearl River Delta region.
Otherwise, plans retain the feel of earlier blueprints for regional development across the country, highlighting certain sectors to be promoted. In Fuzhou, emphasis will be given to cross-Strait e-commerce, service outsourcing and the Internet of Things. Financial services will play a large role in all three provinces. Details are not yet available, but Qianhai in Guangdong, Binhai in Tianjin, and Xiamen in Fujian are all included in their provincial FTZs; all already aspire to be a financial centre for the region, and will probably issue a raft of incentives to encourage further development in this arena. Financial-sector liberalisation was one of the most closely watched initiatives in the Shanghai FTZ, and it was here that expectations have fallen the most. Plans reported for these three provinces discuss building up the financial services sector, but little reference to financial-sector reforms have been made.
Why, then, do they need to be declared FTZs? The promotion of more sophisticated services would require a fairly robust services sector to be already present. As services development has been made a priority and China attempts to draw more investment into previously closed sectors like finance, regions that have already started the process and which have fairly strong services sectors have been chosen for tinkering.
Their broader geopolitical position may have been a consideration as well. Encouraging closer economic and professional ties with Hong Kong and Macau appears to be a core component of the Guangdong FTZ. Likewise, integration with Taiwan features prominently in plans for the Fujian FTZ.
Included in Guangdong's proposed measures are plans to allow more professionals from Hong Kong and Macau to practise in the FTZ—it is implied that these will be services providers. The government will also look into ways to make accommodations with regard to social benefits for Hong Kong and Macau residents living in the FTZ areas. In late January Xiamen University announced that it would create a Fujian FTZ Institute to research related issues, such as the internationalisation of the renminbi and the Maritime Silk Road. At the same time, it will ramp up efforts to recruit graduate and doctoral students from Taiwan. Another proposal from Xiamen officials included policies to attract Taiwan "special" talent in technology or innovation to the city. China's efforts to integrate its economy more closely with those of Hong Kong, Macau and Taiwan may have played a role in the selection of these regions for special favour, over other services-oriented cities in Jiangsu and Zhejiang.
How these plans will actually play out remains to be seen. Their implementation will be heavily localised. Proposed plans released by the Guangdong government suggested that it would set up a co-ordination authority to devise strategies, co-ordinate policies and steer reform, but each of the districts included in the Guangdong FTZ will probably be managed by its own district management body, headed by their respective city governments. This has drawn some local criticism that less will be accomplished than in Shanghai, which had fewer layers of bureaucracy. At the same time, other critics say that Shanghai has accomplished rather little since launching the FTZ. Substantial financial market reforms have yet to materialise. One of the most exciting plans to be announced was the lifting of a ban on video-game consoles.
Furthermore, their limited advantages may already be eroding. On January 28th the State Council announced that the ban on the manufacturing and sale of game consoles would be lifted nationwide. The next day, it announced that the rest of the country will be allowed to adopt preferential policies piloted in the Shanghai FTZ in investment, trade and finance. The excitement around these FTZs may prove short-lived.
The FTZs, which will formally be established on March 1st, differ slightly from that in Shanghai in that they are not confined to a geographic part of one city. The Guangdong FTZ will include three cities in the province: the Nansha New Area in Guangzhou, the Qianhai and Shekou districts of Shenzhen, and Zhuhai's Hengqin New Area. The Tianjin FTZ will include the Tianjin Port Zone, the Tianjin Airport Economic Zone and the Binhai New Area. The Fujian FTZ will include the Pingtan Comprehensive Experimental Zone, parts of Xiamen (including the Xiangyu Bonded Zone), and parts of Fuzhou (including the Fuzhou Economic and Technological Development Zone).
At the same time, some tweaks were made to the Shanghai FTZ's geographic coverage. The zone, which currently sits near the airport, will be expanded to include the Lujiazui financial district, Jinqiao and the Zhanjiang High-tech zone. Progress in the Shanghai zone has been slow to date, which some have blamed on its location far from the city centre.
Zones here, zones there
The broader aim is to find a new growth model under the "new normal" of economic development pursued by the president, Xi Jinping. Goals include fostering innovation-driven growth and improvement in investment efficiency. Aspirations are lofty. In early January Fujian's party secretary, You Quan, announced that through the establishment of the FTZ, Fujian would create a more international, market-oriented and legalistic business environment, and promote long-term sustainable development.Development of the plans for these zones is still under way, but reports by local media in January suggest that the three new zones may have some similarities. "Negative lists", which were piloted in the Shanghai FTZ, are likely to be included. The negative list is a departure from how the government normally supervises foreign investment: under this approach, foreign investors should receive equal treatment to Chinese companies in any sector not explicitly restricted on the list. Guangdong is looking to encourage more investment from Hong Kong and Macau by eliminating or relaxing restrictions in a number of services sectors. Fujian FTZ will probably have similar offerings. According to local media, Pingtan, already designated a zone for cross-Strait co-operation, will also issue a negative list; in it, foreign investment in banking, securities and insurance will be subject to limitations, but Taiwan investors will be exempt. Tianjin plans to issue its own negative list as well, and has boasted that its list will be shorter than that of Shanghai.
Plans to ease customs clearances suggest that trade will continue to play a large role in these areas. In late January Tianjin's mayor discussed improving administrative effectiveness and easing custom clearance in Tianjin's port zone. Guangdong's FTZ encompasses Shekou, which hosts ports and logistics. Preferential policies in the area will include eased custom clearance procedures, too, to help raise the competitiveness of the Pearl River Delta region.
Otherwise, plans retain the feel of earlier blueprints for regional development across the country, highlighting certain sectors to be promoted. In Fuzhou, emphasis will be given to cross-Strait e-commerce, service outsourcing and the Internet of Things. Financial services will play a large role in all three provinces. Details are not yet available, but Qianhai in Guangdong, Binhai in Tianjin, and Xiamen in Fujian are all included in their provincial FTZs; all already aspire to be a financial centre for the region, and will probably issue a raft of incentives to encourage further development in this arena. Financial-sector liberalisation was one of the most closely watched initiatives in the Shanghai FTZ, and it was here that expectations have fallen the most. Plans reported for these three provinces discuss building up the financial services sector, but little reference to financial-sector reforms have been made.
Plus ça change
It is telling that the regions chosen for these pilots are already developed, with mature business districts and development zones that have been established for years. They show that government efforts to reform the economy are recentring on the eastern seaboard. The cities included in these announcements are some of the richest in the country. They already boast high incomes, large exports and strong foreign direct investment. They are already built up, and have some of the highest property prices in the country.Why, then, do they need to be declared FTZs? The promotion of more sophisticated services would require a fairly robust services sector to be already present. As services development has been made a priority and China attempts to draw more investment into previously closed sectors like finance, regions that have already started the process and which have fairly strong services sectors have been chosen for tinkering.
Their broader geopolitical position may have been a consideration as well. Encouraging closer economic and professional ties with Hong Kong and Macau appears to be a core component of the Guangdong FTZ. Likewise, integration with Taiwan features prominently in plans for the Fujian FTZ.
Included in Guangdong's proposed measures are plans to allow more professionals from Hong Kong and Macau to practise in the FTZ—it is implied that these will be services providers. The government will also look into ways to make accommodations with regard to social benefits for Hong Kong and Macau residents living in the FTZ areas. In late January Xiamen University announced that it would create a Fujian FTZ Institute to research related issues, such as the internationalisation of the renminbi and the Maritime Silk Road. At the same time, it will ramp up efforts to recruit graduate and doctoral students from Taiwan. Another proposal from Xiamen officials included policies to attract Taiwan "special" talent in technology or innovation to the city. China's efforts to integrate its economy more closely with those of Hong Kong, Macau and Taiwan may have played a role in the selection of these regions for special favour, over other services-oriented cities in Jiangsu and Zhejiang.
How these plans will actually play out remains to be seen. Their implementation will be heavily localised. Proposed plans released by the Guangdong government suggested that it would set up a co-ordination authority to devise strategies, co-ordinate policies and steer reform, but each of the districts included in the Guangdong FTZ will probably be managed by its own district management body, headed by their respective city governments. This has drawn some local criticism that less will be accomplished than in Shanghai, which had fewer layers of bureaucracy. At the same time, other critics say that Shanghai has accomplished rather little since launching the FTZ. Substantial financial market reforms have yet to materialise. One of the most exciting plans to be announced was the lifting of a ban on video-game consoles.
Furthermore, their limited advantages may already be eroding. On January 28th the State Council announced that the ban on the manufacturing and sale of game consoles would be lifted nationwide. The next day, it announced that the rest of the country will be allowed to adopt preferential policies piloted in the Shanghai FTZ in investment, trade and finance. The excitement around these FTZs may prove short-lived.
Monday, March 2, 2015
MAERSK
Few carriers can show profits similar to Maersk's. What does that say about the future of many container lines? Will investors and governments continue to provide funding to carriers that continue to lose money? Will this be how the excess capacity is dealt with--bankruptcies? What would this do to forwarders and other cheap rate chasers?
Skou, who has headed the world’s biggest container line since the start of 2012, has overseen three successive years of increasing profitability for the company’s liner business, culminating in the $2.2 billion in operating profit it made in 2014. That capped a three-year stretch in which Maersk has made roughly $4.2 billion in operating profits.
“In fourth quarter 2011, we had just lost $600 million, basically,” Skou said. “So it was a different time. This fourth quarter just behind us, we made $655 million. So it’s a completely different scenario. The key drivers of that are cost. In the fourth quarter of 2011, we had costs per FEU north of $3,000. Now we're $2,650 or thereabouts. So it’s a massive change in the cost structure.”
Skou also pointed to Maersk’s ability to better leverage its network.
“Probably the biggest driver has been that we have managed our network," he said. "It is better utilized. We're much quicker to adjust the network to maintain utilization. Our asset turn is up. Our bunker consumption per container is down significantly. You go back three years, we were using 1.2 or 1.3 tons of fuel per (FEU) and now we use 0.9, so it’s a 25 percent reduction. And even though bunker is cheaper now than it was back then, it still makes a big difference."
This period of profitability comes amid a backdrop of several competing dynamics: a long stretch of overcapacity for the carrier industry as a whole; slow ocean freight growth since the 2009 financial crisis; a continuation of long-term rate stagnation; and in North America, the operational issues currently plaguing ports.
Skou said the first two dynamics are governing whether carriers can be profitable or not.
“A key point to understand about the container industry is that growth is a lot lower than what it used to be,” Skou said. “If you take 2012-2014, growth has been averaging just below 4 percent. That’s a lot less than before the financial crisis, where we had growth double that or even in double digits many years. As far as we can see, it’s hard to believe that the good old days will come back any time soon.
“From a historic point of view, the current 18 percent orderbook (meaning current vessels on order are equivalent to 18 percent of the capacity of the current fleet) may sound low, but if the market’s only growing 4 percent per year, it’s four-and-a-half years of growth, minus scrapping. For the growth we have, there’s plenty of ships on order. Given the market, this is still an orderbook where most likely supply will grow slightly faster than demand. That’s at least our planning assumption.”
Skou said carriers must adapt to that reality.
“The industry has to learn to live with lower growth, and a situation with permanent excess supply,” he said. “Most industries actually live with that. We, for some reason in shipping, have a kind of culture that unless the ships are 99.5 percent full, then we don’t believe we’re allowed to make money. But we have to learn to live with excess capacity.”
One way carriers have attempted to redress this capacity issue is by forming mega-alliances and new vessel sharing agreements to augment port coverage and increase sailings available to their customers. For carriers, it allows vessel operators to “sweat their assets better,” said Michael White, president Maersk Line North America.
“With the continued process of having VSAs, which I think is here for the foreseeable future, carriers have to order and say, how does this fit the network that they’re going to deploy with other partners,” White said. “So it is a slightly different ballgame from what they would have done as an individual carrier. I don’t know if you’d call it a check (on capacity growth), you just have to bring it into the broader capacity planning in those different markets so you can fit and avoid the sawtooth (swings in capacity).”
Skou said it’s not yet clear what effect the new broader alliances and VSAs will have. Maersk joined rival Mediterranean Shipping Co. in the 2M alliance as of January after being rebuffed by Chinese regulators from forming an even large alliance with MSC and CMA CGM.
“The reality is we don’t really know because all of these alliances are just starting,” Skou said. “We actually don’t know how that’s going to play out.”
Meanwhile, Skou said it has been hard for Maersk to watch the effects of U.S. West Coast port congestion on its customers. Both Skou and White pointed to lagging port productivity as a cause for the congestion, noting that productivity and infrastructure investment has not kept pace with increasing vessel sizes.
“We’ve tried as a carrier to do what we could to alleviate the situation,” Skou said. “We ran three extra loaders to the East Coast before the Chinese New Year – the total industry ran 14. We've worked very hard to keep our customers informed of the situation in terms of both the track and trace part, but also about what’s really going on. There’s been a lot of rumors, and media points – some of it well-founded, some of it not.”
White said equipment availability has been a moving target.
“We’re giving daily updates to our customers about what was going on, and also the terminal fluidity change,” White said. “Even within L.A., certain terminals were open or closed for receiving different types of equipment on different days. The best thing we could do was arm them with information and work with them as best we could. Equipment availability is what customers are looking for. How quickly you can get it on to the rail and to its destination.”
Despite union longshoremen on the West Coast reaching an apparent agreement on a five-year contract with their terminal operator employers in late February, Skou said shippers should not expect a quick resolution to the congestion.
“The strike being averted is not going to solve the problem,” Skou said. “We've only addressed one of the issues. And many of these issues are related to underinvestment in any kind of infrastructure capacity that we need. And it’s very much related to a lack of progress on productivity in the ports. The reality is that ship sizes have probably doubled over the last seven years, and productivity hasn't gone up marginally. It’s giving us new issues. It’s about when the boxes actually get off the ship. When the ship was in port one or two days, nobody cared. Today, you have ships in port for five days, six days here. That actually matters whether your box gets off first or last.”
Maersk profiting in 'low growth, excess capacity' era
Maersk Line CEO Soren Skou told American Shipper container lines need to adapt to permanent overcapacity, and cited Maersk's network management as the primary driver of bumper profits in recent years.
Container lines need to learn to live in an era of low growth and excess capacity, Maersk Line Chief Executive Officer Soren Skou said in an interview with American Shipper Sunday.Skou, who has headed the world’s biggest container line since the start of 2012, has overseen three successive years of increasing profitability for the company’s liner business, culminating in the $2.2 billion in operating profit it made in 2014. That capped a three-year stretch in which Maersk has made roughly $4.2 billion in operating profits.
“In fourth quarter 2011, we had just lost $600 million, basically,” Skou said. “So it was a different time. This fourth quarter just behind us, we made $655 million. So it’s a completely different scenario. The key drivers of that are cost. In the fourth quarter of 2011, we had costs per FEU north of $3,000. Now we're $2,650 or thereabouts. So it’s a massive change in the cost structure.”
Skou also pointed to Maersk’s ability to better leverage its network.
“Probably the biggest driver has been that we have managed our network," he said. "It is better utilized. We're much quicker to adjust the network to maintain utilization. Our asset turn is up. Our bunker consumption per container is down significantly. You go back three years, we were using 1.2 or 1.3 tons of fuel per (FEU) and now we use 0.9, so it’s a 25 percent reduction. And even though bunker is cheaper now than it was back then, it still makes a big difference."
This period of profitability comes amid a backdrop of several competing dynamics: a long stretch of overcapacity for the carrier industry as a whole; slow ocean freight growth since the 2009 financial crisis; a continuation of long-term rate stagnation; and in North America, the operational issues currently plaguing ports.
Skou said the first two dynamics are governing whether carriers can be profitable or not.
“A key point to understand about the container industry is that growth is a lot lower than what it used to be,” Skou said. “If you take 2012-2014, growth has been averaging just below 4 percent. That’s a lot less than before the financial crisis, where we had growth double that or even in double digits many years. As far as we can see, it’s hard to believe that the good old days will come back any time soon.
“From a historic point of view, the current 18 percent orderbook (meaning current vessels on order are equivalent to 18 percent of the capacity of the current fleet) may sound low, but if the market’s only growing 4 percent per year, it’s four-and-a-half years of growth, minus scrapping. For the growth we have, there’s plenty of ships on order. Given the market, this is still an orderbook where most likely supply will grow slightly faster than demand. That’s at least our planning assumption.”
Skou said carriers must adapt to that reality.
“The industry has to learn to live with lower growth, and a situation with permanent excess supply,” he said. “Most industries actually live with that. We, for some reason in shipping, have a kind of culture that unless the ships are 99.5 percent full, then we don’t believe we’re allowed to make money. But we have to learn to live with excess capacity.”
One way carriers have attempted to redress this capacity issue is by forming mega-alliances and new vessel sharing agreements to augment port coverage and increase sailings available to their customers. For carriers, it allows vessel operators to “sweat their assets better,” said Michael White, president Maersk Line North America.
“With the continued process of having VSAs, which I think is here for the foreseeable future, carriers have to order and say, how does this fit the network that they’re going to deploy with other partners,” White said. “So it is a slightly different ballgame from what they would have done as an individual carrier. I don’t know if you’d call it a check (on capacity growth), you just have to bring it into the broader capacity planning in those different markets so you can fit and avoid the sawtooth (swings in capacity).”
Skou said it’s not yet clear what effect the new broader alliances and VSAs will have. Maersk joined rival Mediterranean Shipping Co. in the 2M alliance as of January after being rebuffed by Chinese regulators from forming an even large alliance with MSC and CMA CGM.
“The reality is we don’t really know because all of these alliances are just starting,” Skou said. “We actually don’t know how that’s going to play out.”
Meanwhile, Skou said it has been hard for Maersk to watch the effects of U.S. West Coast port congestion on its customers. Both Skou and White pointed to lagging port productivity as a cause for the congestion, noting that productivity and infrastructure investment has not kept pace with increasing vessel sizes.
“We’ve tried as a carrier to do what we could to alleviate the situation,” Skou said. “We ran three extra loaders to the East Coast before the Chinese New Year – the total industry ran 14. We've worked very hard to keep our customers informed of the situation in terms of both the track and trace part, but also about what’s really going on. There’s been a lot of rumors, and media points – some of it well-founded, some of it not.”
White said equipment availability has been a moving target.
“We’re giving daily updates to our customers about what was going on, and also the terminal fluidity change,” White said. “Even within L.A., certain terminals were open or closed for receiving different types of equipment on different days. The best thing we could do was arm them with information and work with them as best we could. Equipment availability is what customers are looking for. How quickly you can get it on to the rail and to its destination.”
Despite union longshoremen on the West Coast reaching an apparent agreement on a five-year contract with their terminal operator employers in late February, Skou said shippers should not expect a quick resolution to the congestion.
“The strike being averted is not going to solve the problem,” Skou said. “We've only addressed one of the issues. And many of these issues are related to underinvestment in any kind of infrastructure capacity that we need. And it’s very much related to a lack of progress on productivity in the ports. The reality is that ship sizes have probably doubled over the last seven years, and productivity hasn't gone up marginally. It’s giving us new issues. It’s about when the boxes actually get off the ship. When the ship was in port one or two days, nobody cared. Today, you have ships in port for five days, six days here. That actually matters whether your box gets off first or last.”
PAYING CHINESE SUPPLIERS IN RENMINBI
To Renminbi or Not to Renminbi – What should Procurement Organizations do?
- February 26, 2015 3:33 AM
Categories: Trade Credit Commentary | Tags: AdvantageBC, offshore RMB, renminbi invoicing, RMB settlement


Categories: Trade Credit Commentary | Tags: AdvantageBC, offshore RMB, renminbi invoicing, RMB settlement

When a Chinese company asks you to do business in RMB instead of the USD, are you ready?
Are your Chinese suppliers able to reduce prices if you buy in RMB instead of USD or Euros?
Following the November 2014 announcement by China’s central bank naming Canada as a Renminbi Settlement Hub, work is currently in progress to put the necessary infrastructure and processes in place to allow for RMB-denominated transactions to be settled and cleared between North American and China using a settlement hub in Vancouver, B.C.
I recently attended a workshop provided by AdvantageBC on Canada’s role as an offshore RMB settlement Hub.
The Rise of the RMB: An Overview
The RMB is now the fastest growing settlement currency, rising to the #5 spot based on SWIFT December 2014 data. It has overtaken the Aussie Dollar, Canadian Dollar and even the Swiss Franc.
The challenge is that the RMB is not a freely tradable currency, at least not yet nor in the foreseeable future (although some pundits believe the Chinese Central Bank have a five year plan). So if you want to trade in Chinese currency, you need to use Offshore Centers designated by the Chinese Central bank. Canada was the tenth RMB Settlement Hub to be designated by the Peoples Bank of China. The following week, the Industrial Commercial Bank of China was designated as the clearing bank for the Vancouver Hub.
How do you make the change to using RMB?What do you do when the Chinese company you are doing business with asks that settlement be in RMB instead of US or Canadian dollars? Certainly the Chinese supplier should be able to save money in currency exchange costs as well as reduced hedging costs and reduced risks. A recent HSBC survey showed that Chinese companies would be prepared to offer as much as a 5% price benefit.
This is driven totally by three facts:
How does the RMB settlement process work?If you are based in the U.S. and are using RMB, chances are you are going through the Hong Kong settlement hub. ICBC will hold RMB trading accounts in your name (via your own bank, so your bank will have a Correspondent bank relationship with ICBC). In addition, ICBC will offer asset management and other services.
As I listened to the presentation, my thoughts centered on how you make corporates aware and educated on the mechanics of making this happen in their own organization. Given there are multiple internal departments, each with different agendas, KPIs, success measures, that is not easy. Think about it for a minute. A corporation runs a complex web of systems - ERP, purchasing, treasury, etc. so it's no simple exercise and requires more than just a belief in a survey that says you can get 5% reductions from your suppliers. You also need to know what you are going to do with all that RMB if you sell in RMB. You now take the currency risk. Or conversely, fund an account with RMB to support millions of purchases.
This is a very interesting area, and I personally believe it is worth the effort in your own organization to start getting smart about this. My advice – engage your banker and ask the right questions internally as well. Also talk to your Chinese suppliers – is this something they would get excited about.
Are your Chinese suppliers able to reduce prices if you buy in RMB instead of USD or Euros?
Following the November 2014 announcement by China’s central bank naming Canada as a Renminbi Settlement Hub, work is currently in progress to put the necessary infrastructure and processes in place to allow for RMB-denominated transactions to be settled and cleared between North American and China using a settlement hub in Vancouver, B.C.
I recently attended a workshop provided by AdvantageBC on Canada’s role as an offshore RMB settlement Hub.
The Rise of the RMB: An Overview
The RMB is now the fastest growing settlement currency, rising to the #5 spot based on SWIFT December 2014 data. It has overtaken the Aussie Dollar, Canadian Dollar and even the Swiss Franc.
The challenge is that the RMB is not a freely tradable currency, at least not yet nor in the foreseeable future (although some pundits believe the Chinese Central Bank have a five year plan). So if you want to trade in Chinese currency, you need to use Offshore Centers designated by the Chinese Central bank. Canada was the tenth RMB Settlement Hub to be designated by the Peoples Bank of China. The following week, the Industrial Commercial Bank of China was designated as the clearing bank for the Vancouver Hub.
How do you make the change to using RMB?What do you do when the Chinese company you are doing business with asks that settlement be in RMB instead of US or Canadian dollars? Certainly the Chinese supplier should be able to save money in currency exchange costs as well as reduced hedging costs and reduced risks. A recent HSBC survey showed that Chinese companies would be prepared to offer as much as a 5% price benefit.
This is driven totally by three facts:
- The Chinese seller does not have to manage FX risk,
- The Chinese seller does not have to go through China’s State Administration for Foreign Exchange (SAFE) to exchange RMB for USD (a huge headache) and
- The Chinese seller can borrow in RMB on those receivables at better rates than USD receivables.
How does the RMB settlement process work?If you are based in the U.S. and are using RMB, chances are you are going through the Hong Kong settlement hub. ICBC will hold RMB trading accounts in your name (via your own bank, so your bank will have a Correspondent bank relationship with ICBC). In addition, ICBC will offer asset management and other services.
As I listened to the presentation, my thoughts centered on how you make corporates aware and educated on the mechanics of making this happen in their own organization. Given there are multiple internal departments, each with different agendas, KPIs, success measures, that is not easy. Think about it for a minute. A corporation runs a complex web of systems - ERP, purchasing, treasury, etc. so it's no simple exercise and requires more than just a belief in a survey that says you can get 5% reductions from your suppliers. You also need to know what you are going to do with all that RMB if you sell in RMB. You now take the currency risk. Or conversely, fund an account with RMB to support millions of purchases.
This is a very interesting area, and I personally believe it is worth the effort in your own organization to start getting smart about this. My advice – engage your banker and ask the right questions internally as well. Also talk to your Chinese suppliers – is this something they would get excited about.
Sunday, March 1, 2015
SUPPLY CHAINS, TECHNOLOGY
Too many articles have simple answers for complex supply chain management. Often involve technology / analytics. Technology is important, but so is process. Did authors ever run a supply chain?

Subscribe to:
Posts (Atom)
Share this: