Trade recovery expected in 2017 and 2018, amid policy uncertainty
Growth in the volume of world merchandise trade is expected to rebound this year from its tepid performance in 2016, but only if the global economy recovers as expected and governments pursue the right policy mix, WTO economists reported.
MAIN POINTS
The WTO is forecasting that global trade will expand by 2.4% in 2017; however, as deep uncertainty about near-term economic and policy developments raise the forecast risk, this figure is placed within a range of 1.8% to 3.6%. In 2018, the WTO is forecasting trade growth between 2.1% and 4%. - World merchandise trade volume is forecast to grow 2.4% in 2017, but due to a high level of uncertainty, this is placed within a range of 1.8-3.6%.
- This is up from a very weak 1.3% in 2016, as global GDP growth rises to 2.7% this year from 2.3% last year.
- Trade growth in 2018 should pick up slightly to between 2.1-4.0%.
- The ratio of trade growth to GDP growth fell below 1:1 in 2016, for the first time since 2001.
- The slowdown in emerging market economies contributed much to the sluggish rate of trade growth in 2016, but these countries are expected to return to modest growth in 2017.
- Export orders and container shipping have been strong in the early months of 2017, but trade recovery could be undermined by policy shocks.
- Policy uncertainty is the main risk factor, including imposition of trade restrictive measures and monetary tightening.
The unpredictable direction of the global economy in the near term and the lack of clarity about government action on monetary, fiscal and trade policies raises the risk that trade activity will be stifled. A spike in inflation leading to higher interest rates, tighter fiscal policies and the imposition of measures to curtail trade could all undermine higher trade growth over the next two years.
"Weak international trade growth in the last few years largely reflects continuing weakness in the global economy. Trade has the potential to strengthen global growth if the movement of goods and supply of services across borders remains largely unfettered. However, if policymakers attempt to address job losses at home with severe restrictions on imports, trade cannot help boost growth and may even constitute a drag on the recovery," said WTO Director-General Roberto Azevêdo.
"Although trade does cause some economic dislocation in certain communities, its adverse effects should not be overstated – nor should they obscure its benefits in terms of growth, development and job creation. We should see trade as part of the solution to economic difficulties, not part of the problem. In fact, innovation, automation and new technologies are responsible for roughly 80% of the manufacturing jobs that have been lost and no one questions that technological advances benefit most people most of the time. The answer is therefore to pursue policies that reap the benefits from trade, while also applying horizontal solutions to unemployment which embraces better education and training and social programmes that can quickly help get workers back on their feet and ready to compete for the jobs of the future," he said.
The WTO's more promising forecasts for 2017 and 2018 are predicated on certain assumptions and there is considerable downside risk that expansion will fall short of these estimates. Attaining these rates of growth depends to a large degree on global GDP expansion in line with forecasts of 2.7% this year and 2.8% next year. While there are reasonable expectations that such growth could be achieved, expansion along these lines would represent a significant improvement on the 2.3% GDP growth in 2016.
In 2016, the weak trade growth of just 1.3% was partly due to cyclical factors as economic activity slowed across the board, but it also reflected deeper structural changes in the relationship between trade and economic output. The most trade-intensive components of global demand were particularly weak last year as investment spending slumped in the United States and as China continued to rebalance its economy away from investment and toward consumption, dampening import demand.
Global economic growth has been unbalanced since the financial crisis, but for the first time in several years all regions of the world economy should experience a synchronized upturn in 2017. This could reinforce growth and provide an additional boost to trade.
Forward looking indicators, including the WTO’s World Trade Outlook Indicator, point to stronger trade growth in the first half of 2017, but policy shocks could easily undermine positive recent trends. Unexpected inflation could force central banks to tighten monetary policy faster than they would like, undercutting economic growth and trade in the short-run. Other factors, such as the uncertainty provoked by the United Kingdom's withdrawal from the European Union could potentially have an effect. Meanwhile, the possibility of a rise in the application of restrictive trade policies could affect demand and investment flows, and cut economic growth over the medium-to-long term. In light of these factors, there is a significant risk that trade expansion in 2017 will fall into the lower end of the range.
The recovery of world trade this year and next is based on expected world real GDP growth at market exchange rates of 2.7% in 2017 and 2.8% in 2018. This GDP estimate assumes that developed economies maintain generally expansionary monetary and fiscal policies, and that developing economies continue to emerge from their recent slowdown. It should be noted that the WTO does not produce its own GDP forecasts, but rather uses consensus estimates based on a variety of sources including the International Monetary Fund, the Organization for Economic Cooperation and Development, and the United Nations, among others (Table 1).
Historically, the volume of world merchandise trade has tended to grow about 1.5 times faster than world output, although in the 1990s it grew more than twice as fast. However, since the financial crisis, the ratio of trade growth to GDP growth has fallen to around 1:1. Last year marked the first time since 2001 that this ratio has dropped below 1, to a ratio of 0.6:1 (Chart 1). The ratio is expected to partly recover in 2017, but it remains a cause for concern.
Chart 1: Ratio of world merchandise trade volume growth to world real GDP growth, 1981-2016
% change and ratio
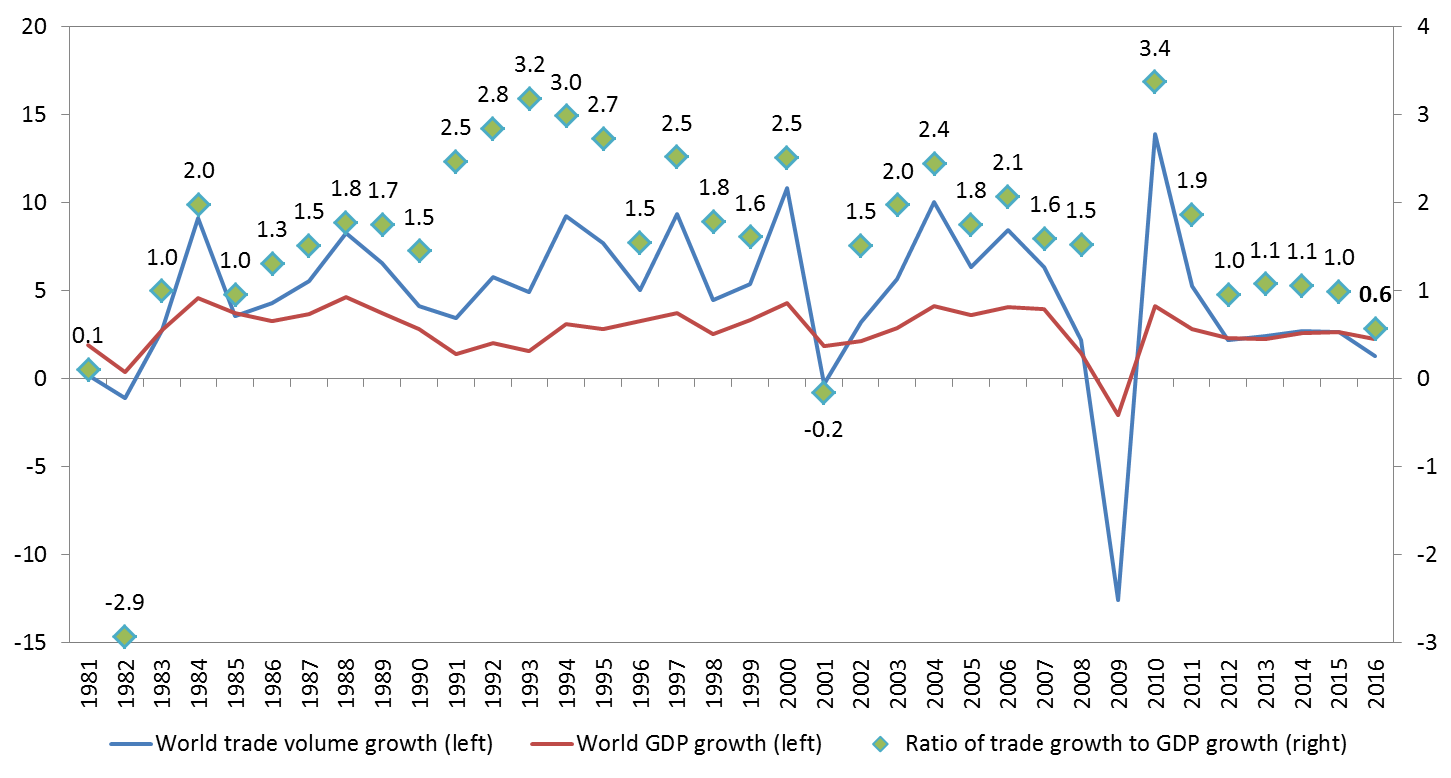
Sources: WTO Secretariat for trade, consensus estimates for GDP
Box 1: Import adjusted demand
A forthcoming WTO working paper by Auboin and Borino examines the reduced sensitivity of trade to GDP, explaining the post-crisis trade slowdown in terms of the expenditure components of demand (consumption, government spending, investment and exports). The paper develops an import intensity-adjusted measure of demand (IAD) that takes into account the import content of spending, with investment being the most trade intensive in most countries and government expenditure being the least. This measurement explains much of the trade slowdown since 2012-15 and could help to improve the accuracy of trade forecasts in the future. Projections for 2017 and 2018 using IAD produce slightly weaker import growth for developed countries and slightly stronger imports for developing economies, which is as expected given the higher rates of investment in developing countries.
Import intensity can change over time with implications for world trade (see Chart 2 and Appendix Chart 1). For example, the import content of Chinese investment spending fell from around 30% in 2004 to 18% in 2014 as China sourced intermediate goods domestically. Meanwhile, the imported content of German investment rose from 24% to 38% between 1995 and 2014. These changes could conceivably alter the geographic distribution of trade, with stronger trade in Europe and weaker trade in Asia. Low oil prices would also be expected to reduce investment in the energy sector, which probably contributed to weakness of imports in resource exporting regions in 2016.
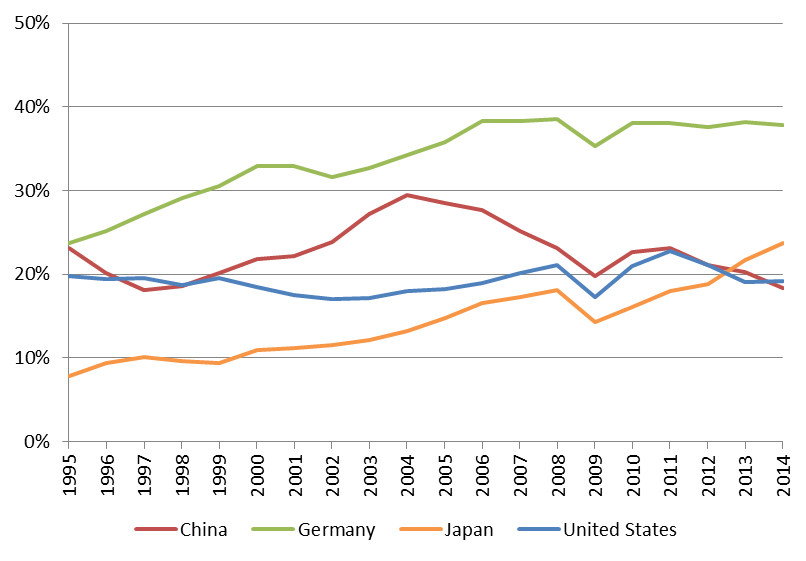
Import intensity can change over time with implications for world trade (see Chart 2 and Appendix Chart 1). For example, the import content of Chinese investment spending fell from around 30% in 2004 to 18% in 2014 as China sourced intermediate goods domestically. Meanwhile, the imported content of German investment rose from 24% to 38% between 1995 and 2014. These changes could conceivably alter the geographic distribution of trade, with stronger trade in Europe and weaker trade in Asia. Low oil prices would also be expected to reduce investment in the energy sector, which probably contributed to weakness of imports in resource exporting regions in 2016.
Chart 2: Import content of investment for selected economies, 1995-2014

Source: World Input-Output Database (WIOD).
Details on trade developments in 2016
The unusually low 1.3% growth in world merchandise trade volume in 2016 was the result of several risk factors converging over the course of the year. These weighed on imports of both developed and developing economies, although the latter were more affected (Chart 3).Developing economies suffered a sharp 3% decline in imports in the first quarter, equivalent to an annualized drop of 11.6%, but growth resumed in the second quarter and losses were recovered by the end of the year. Meanwhile developed economies' imports continued to grow but at a reduced pace. The weakness of imports was reflected on the export side in slow growth of shipments from both developed and developing countries.
For the year, imports of developed countries grew 2.0% while those of developing economies stagnated at 0.2%. Exports recorded modest growth in both developed and developing countries, 1.4% in the former and 1.3% in the latter.
Geographic regions were affected to varying degrees by the slump in trade in 2016 (Chart 4). The first quarter was characterized by financial turbulence that affected China and its regional trading partners, as fears of an economic hard-landing and currency depreciation increased. Asian imports dropped in Q1, but the slump was short-lived and Asia ultimately recorded growth of 2.0% for the year.
Chart 3: Volume of merchandise exports and imports by level of development, 2012Q1-2016Q4
Seasonally adjusted indices, 2012Q1=100
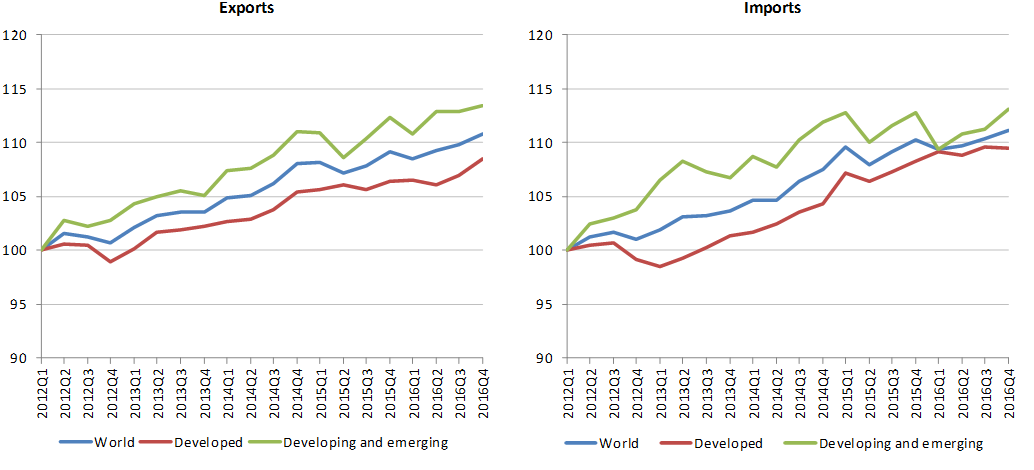
Source: WTO Secretariat.
Declines in imports of South America and Other regions (comprising Africa, the Middle East and the Commonwealth of Independent States) were steeper and more persistent, driven mostly by low commodity prices. Much of South America's decline was due to Brazil, which remained mired in a severe recession. Meanwhile, Europe's exports and imports grew faster than North America's, which have been mostly flat since the start of 2015.Chart 4: Volume of merchandise exports and imports by region, 2012Q1-2016Q4
Seasonally adjusted indices, 2012Q1=100
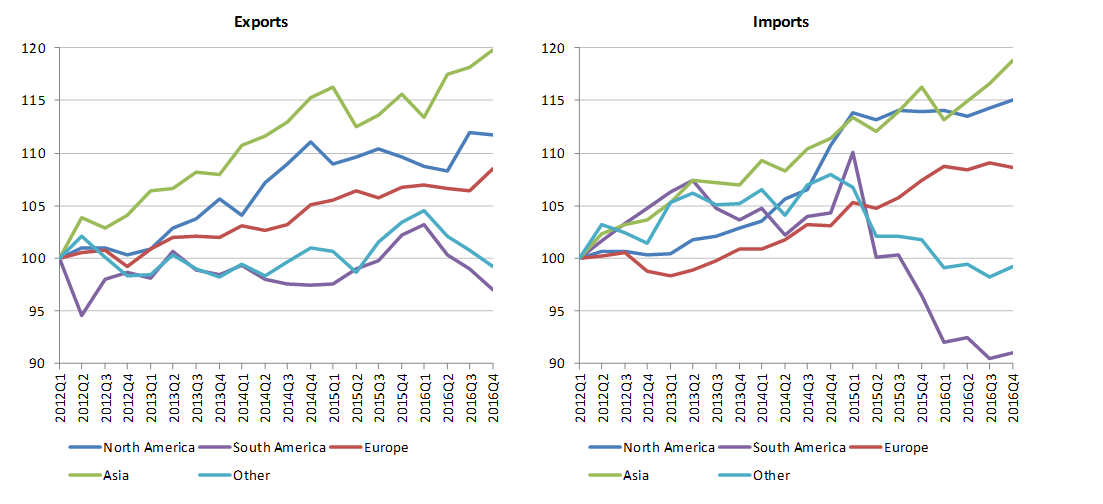
Source: WTO Secretariat.
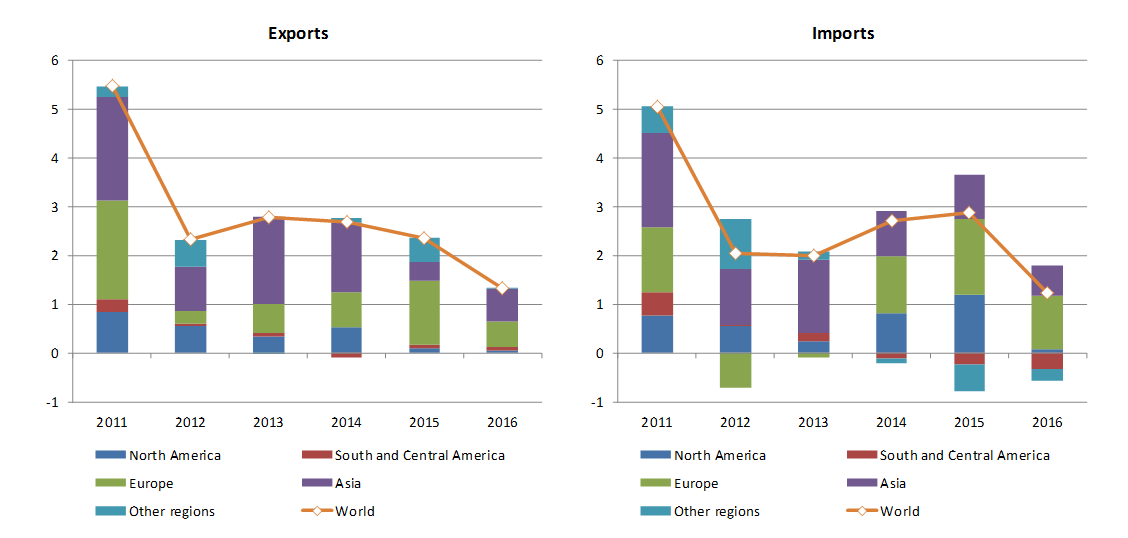
Despite positive growth in its exports and imports, North America was one of the biggest contributors to the weakness of world imports in 2016. This is illustrated by Chart 5, which shows regional contributions to world trade volume growth. In 2015, North American imports added 1.2 percentage points to world import growth of 2.9%, or 42% of the total increase. By contrast, the region only contributed 0.1 percentage points to world import growth of 1.2% last year. Asia and Europe were the only regions making significant positive contributions to global import demand in 2016, with Europe contributing 1.6 percentage points (39% of the total increase) and Asia adding 1.9 percentage points (49% of the total).
Chart 5: Contributions to world trade volume growth by region, 2011-2016
Annual % change
Source: WTO Secretariat.
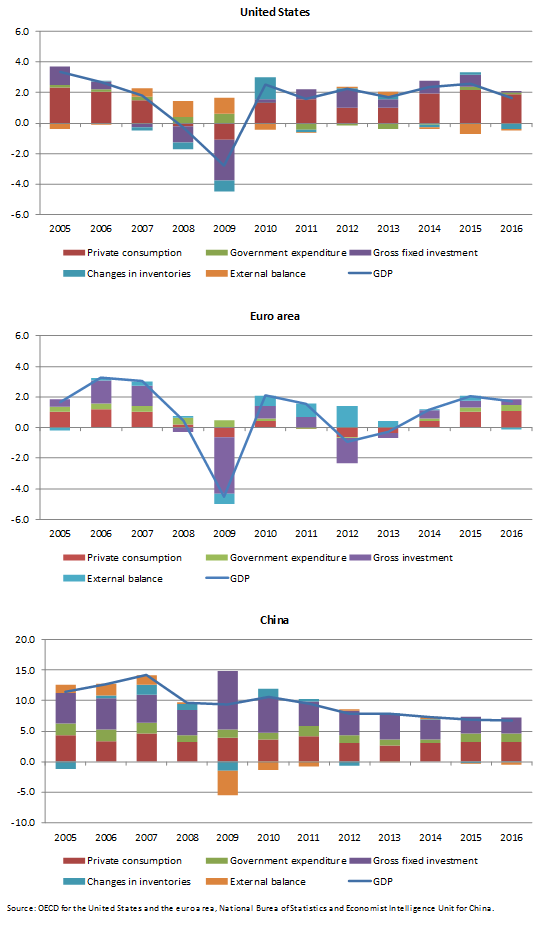
Reasons for the lacklustre performance of North America’s trade are multi-faceted, but they include low oil prices and declining rates of investment, particularly in the energy sector. Investment made essentially no positive contribution to GDP growth in the United States in 2016 (see Appendix Chart 1). Investment is the most import intensive component of GDP and has been particularly weak in developed countries since the financial crisis, with sharp contractions in Europe in 2012 and 2013 during the sovereign debt crisis. The contribution of investment to China’s economic growth has also declined, albeit more gradually. Investment accounted for more than half of China’s GDP growth in 2012-13, but by 2016 this had fallen to 39%.
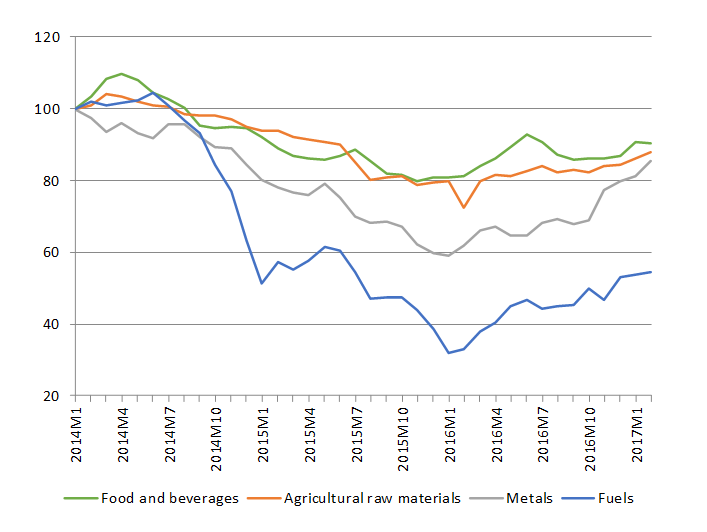
Commodity prices and exchange rates played a large role in the disappointing trade performance of 2016. Plunging prices for oil and metals since the middle of 2014 deprived resource exporting regions of revenue to purchase imports. Commodity prices have stabilized and staged a partial recovery, but a return to price levels of a few years ago is unlikely as long as oil inventories remain high and the US dollar remains strong (Chart 6).
Commodity price declines have distributional impacts across countries, helping net importers and harming net exporters, so their impact is ambiguous in principle. In practice, however, the price slide since 2014 appears to have had a large negative impact on oil producing countries without a corresponding positive impact in importing countries.
Chart 6: Prices of primary commodities, January 2014-February 2017
Indices, January 2014=100
Source: IMF Primary Commodity Prices.
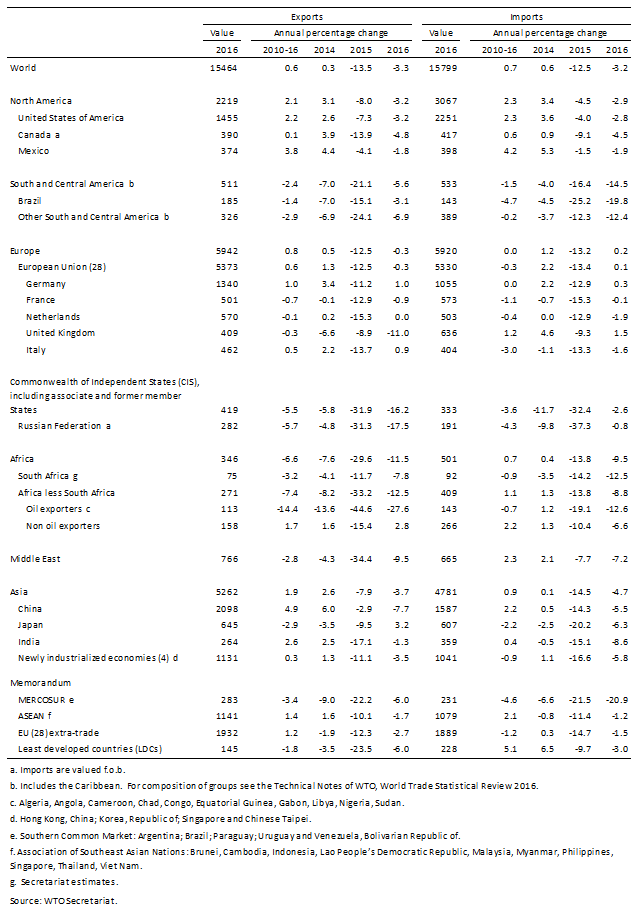
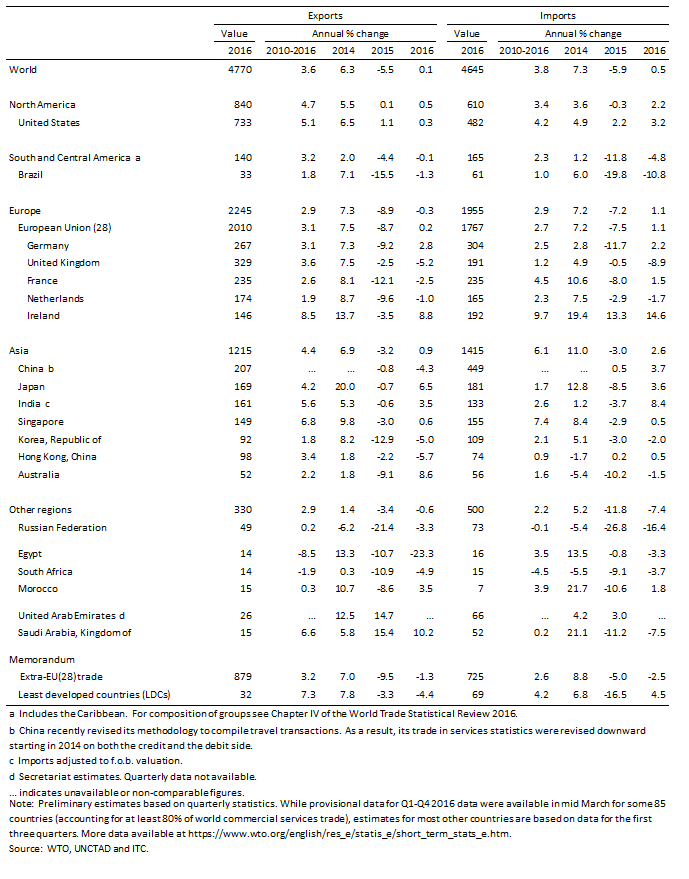
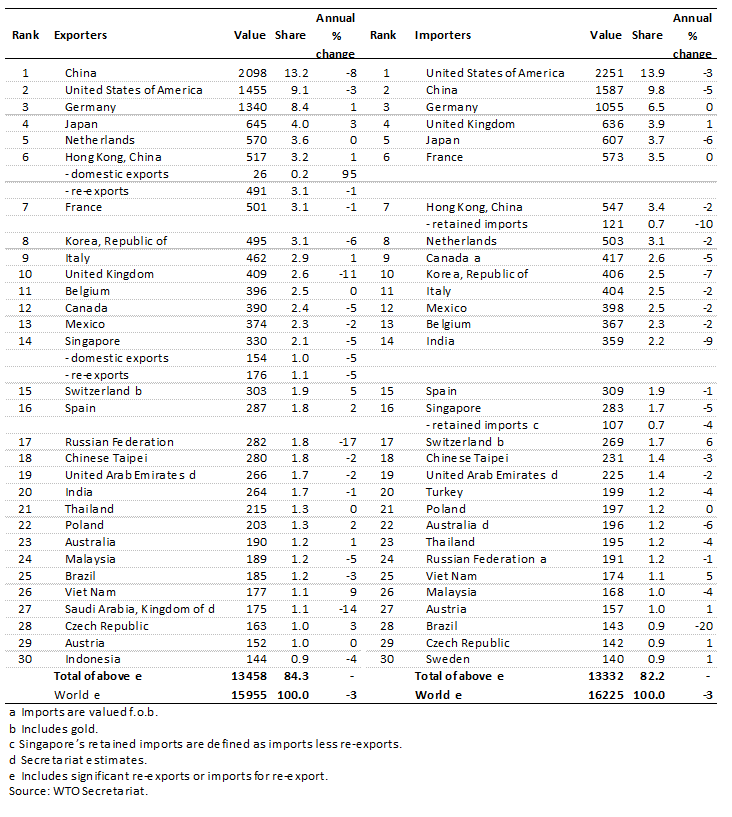
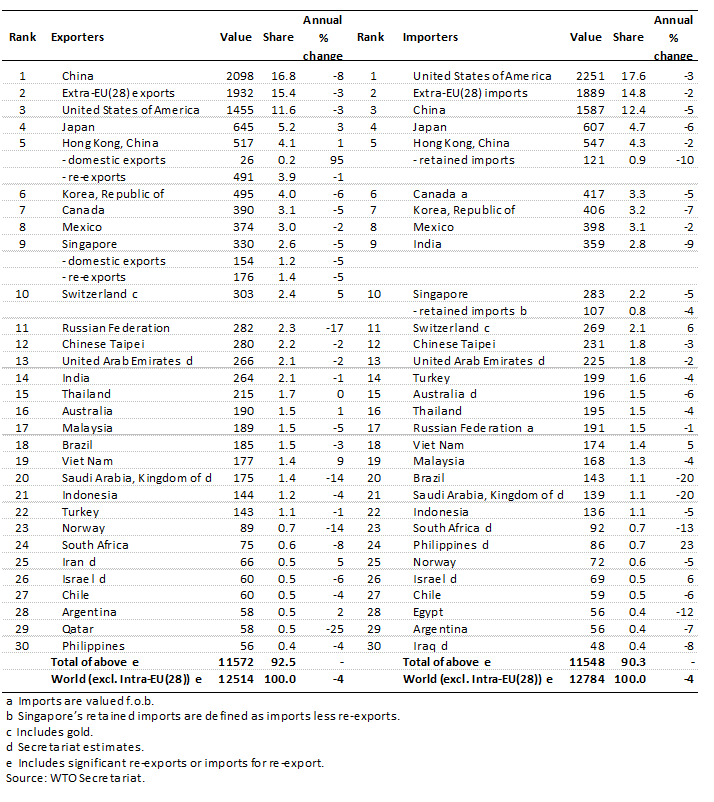
Dollar values of international trade flows have been strongly influenced by exchange rates in recent years. In 2016, world merchandise exports were valued at US$ 15.46 trillion, down 3.3% from the previous year. All regions recorded declines in exports, with the smallest drop registered by Europe (-0.3%) and the largest reported by the Commonwealth of Independent States (-16.2%). On the import side Europe saw a small increase of 0.2%, while all other regions recorded declines (See Appendix Tables 1 – 6 and Appendix Chart 2 for nominal trade developments).There were no major changes in rankings of merchandise exporters and importers. The Republic of Korea dropped from 6th to 8th place in export rankings when individual European Union member countries are counted separately, but it only fell from 5th to 6th place with the EU treated as a single trader.
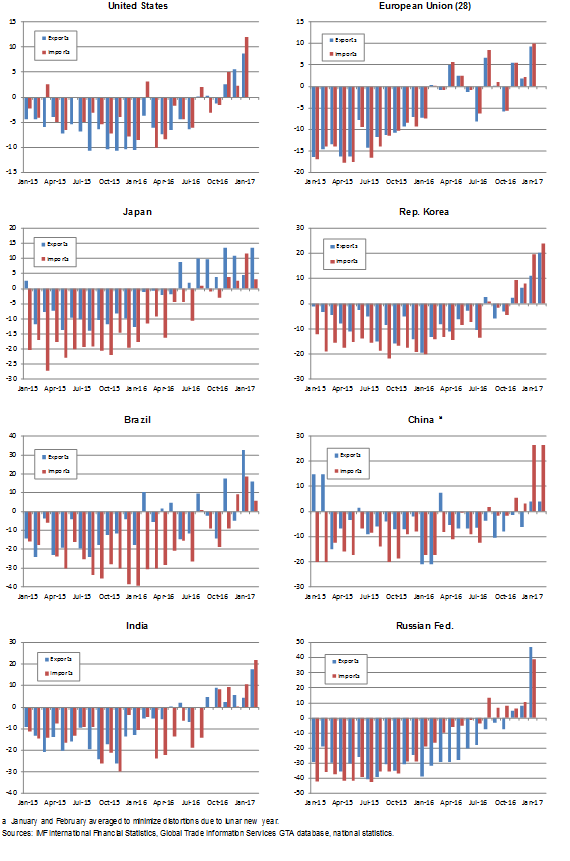
Appendix Chart 2 shows year-on-year growth in monthly exports and imports of selected major traders through February. Trade values are clearly recovering in the early months of 2017, but whether this growth can be sustained throughout the year remains to be seen. Much of the increase can be explained by weakness in trade growth in the previous year rather than strong growth in the current year.
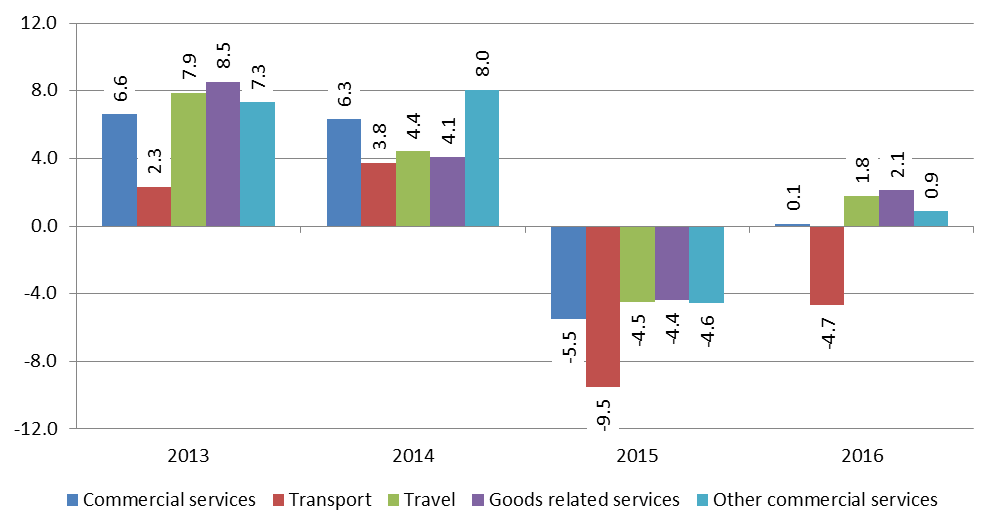
Chart 7: Growth in the value of commercial services exports by category, 2013-16
% change in US$ values
Source: WTO Secretariat.
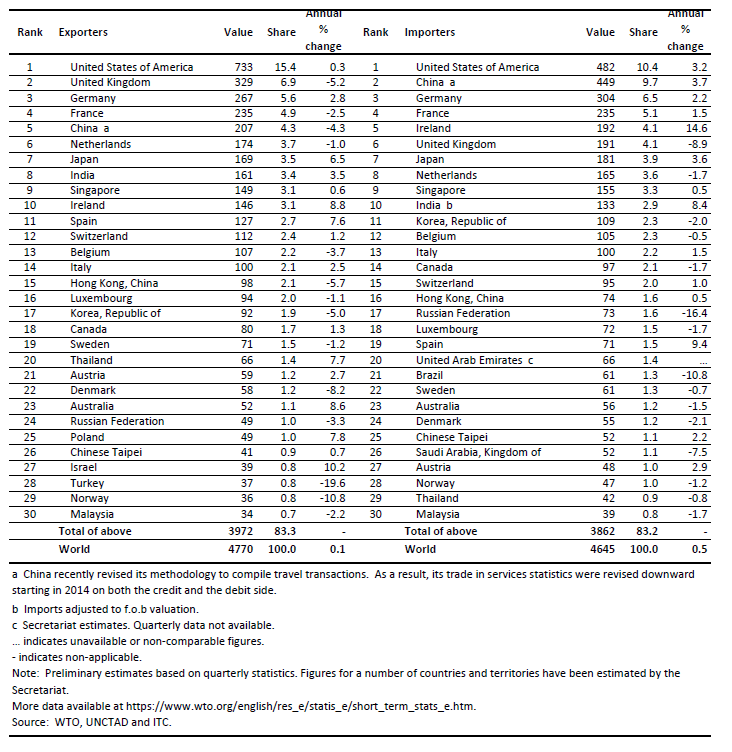
World commercial services exports were essentially unchanged in 2016 after having fallen 5.5% in value in 2015. This is illustrated by Chart 7, which shows growth in the dollar value of commercial services exports since 2013, broken down by major services categories. Total commercial services trade only grew 0.1% in 2016 and transport services fell 4.7%. Other types of services exports saw modest increases including other commercial services, a category that includes financial services. Detailed breakdowns of commercial services trade by region and country are shown in Appendix Tables 2, 5 and 6. Asia recorded the largest regional year-on-year increase in services in 2016 on both the export and import sides (0.9% and 2.6%, respectively). Meanwhile, Other regions (including Africa, Middle East and the Commonwealth of Independent States) had the largest declines (-0.6% and -7.4%). In general, trade in commercial services tends to be less volatile than merchandise trade.
Outlook for trade in 2017 and 2018
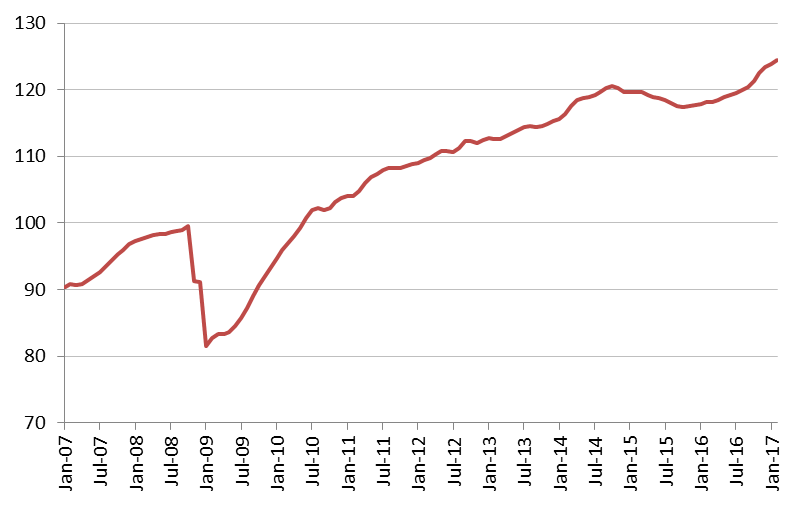
Leading indicators of real trade growth are up in the early months of 2017, suggesting a strengthening of trade at the start of this year. Container throughput of major ports has recovered from its slump of 2015-16 to reach a record high level, with year-on-year growth of 5.2% in the first two months of 2017 (Chart 8). A key index of world export orders has also climbed to its highest level in several years in February, pointing to faster trade growth in the coming months (Chart 9). Finally, estimates of world GDP growth at market exchange rates have risen from 2.3% in 2016 to 2.7% in 2017 and 2.8% in 2018.Chart 8: Container shipping throughput index, January 2007 - February 2017
Seasonally adjusted trend index, 2010=100
Source: Institute for Shipping Economics and Logistics.
Balanced against these positive indications are a number of clear and significant risks. Growing anti-globalization sentiment and the rise of populist political movements have increased the likelihood that restrictive trade measures will be employed more widely. Narrowly targeted measures would probably not have an appreciable impact on world trade and output, but across-the-board measures or abandonment of existing trade agreements could damage consumer and business confidence and undermine international trade and investment.With inflationary pressures building gradually in developed countries, central banks could also accelerate their pace of monetary tightening, with negative consequences for economic growth and trade in the short-run. Changes in fiscal policy could also have unintended international consequences that could reduce global economic activity and trade.
In Europe, challenging negotiations between the United Kingdom and the rest of the European Union will increase uncertainty about the shape of their trade relations in the future. Sovereign debt in highly indebted EU countries is still an outstanding issue that may come to the fore once again over the next two years.
These and other risks are reflected in indices of policy uncertainty, which have increased sharply since 2015 (Chart 10).
Chart 9: Global purchasing managers index of new export orders, January 2012 - February 2017
Index, base=50
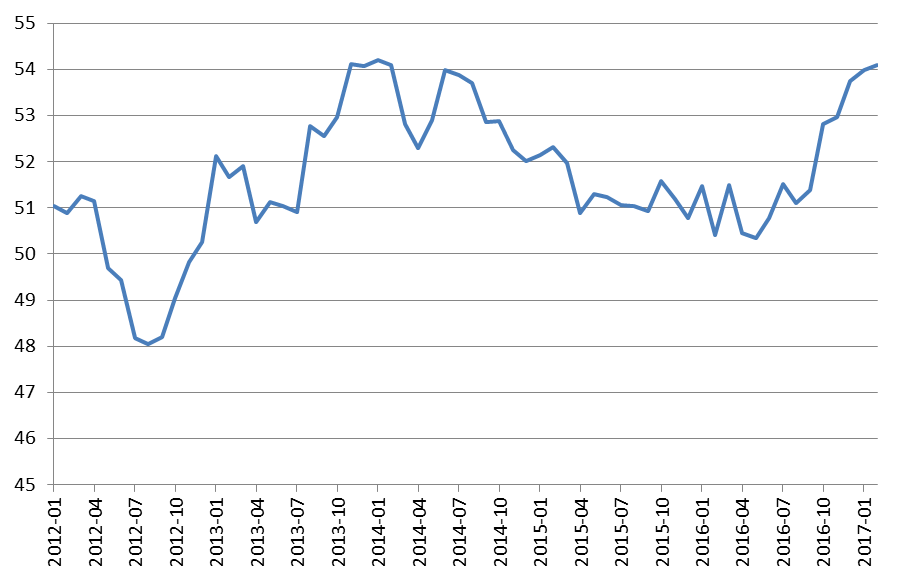
Note: Figures greater than 50 indicate expansion while figures less than 50 denote contraction. Source: IHS-Markit
Assuming that developed economies maintain generally accommodative fiscal and monetary policies, that economic recovery in emerging economies proceeds gradually, and that restrictive trade measures do not proliferate, we would expect merchandise trade to grow 2.4% in volume terms in 2017. However, given the significant downside risks and the prolonged period of weak trade growth in recent years, this growth is placed within a range of 1.8% to 3.6%. World trade growth could be as low as 1.8% in 2017 if downside risks emerge, or it could be as high as 3.6% if our basic assumptions are too pessimistic, but the upside potential is less likely. In 2018 trade volume growth should be between 2.1% and 4.0% (Table 1). Table 1: Merchandise trade volume and real GDP, 2013-2018 a
Annual % change
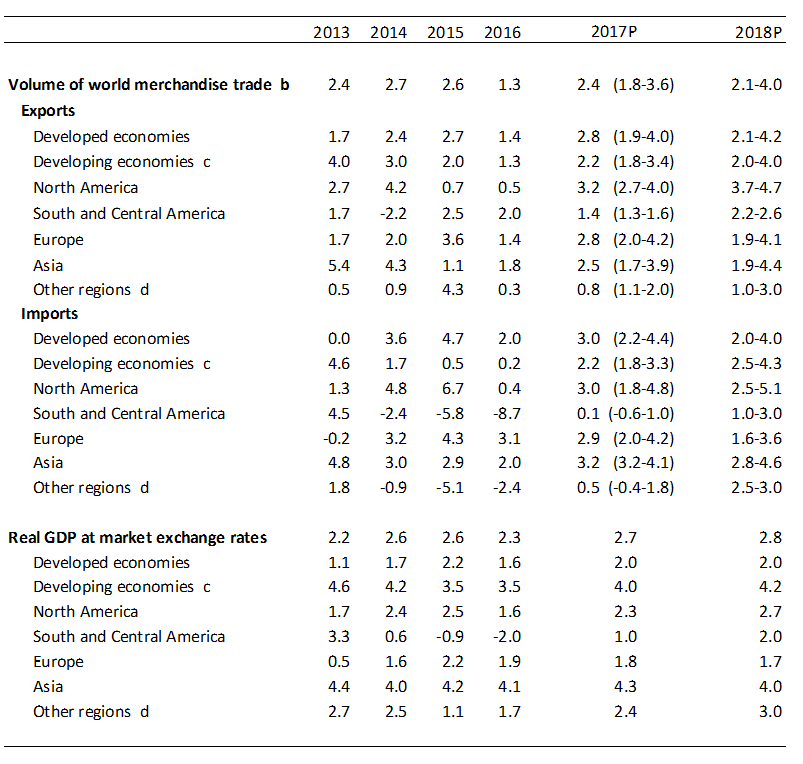
a. Figures for 2017 and 2018 are projections.
b. Average of exports and imports.
c. Includes the Commonwealth of Independent States (CIS), including associate and former member States.
d. Other regions comprise Africa, Commonwealth of Independent States (CIS), and Middle East.
Sources: WTO Secretariat for trade; consensus estimates for GDP, with data source from the International
Monetary Fund (IMF), Organisation for Economic Cooperation and Development (OECD), the United Nations,
the Economist Intelligence Unit (EIU) and a variety of national sources.
The approach to calculating estimates for forecast periods (2017 and 2018) has been refined to reflect the high level of uncertainty in the global economy and to mitigate problems of over-estimation that have characterized economic forecasts since the financial crisis. Despite these corrections, risks remain predominantly on the downside. b. Average of exports and imports.
c. Includes the Commonwealth of Independent States (CIS), including associate and former member States.
d. Other regions comprise Africa, Commonwealth of Independent States (CIS), and Middle East.
Sources: WTO Secretariat for trade; consensus estimates for GDP, with data source from the International
Monetary Fund (IMF), Organisation for Economic Cooperation and Development (OECD), the United Nations,
the Economist Intelligence Unit (EIU) and a variety of national sources.
Chart 10: Global policy uncertainty, January 2014 - February 2017
Index, mean of 1997-2015=100
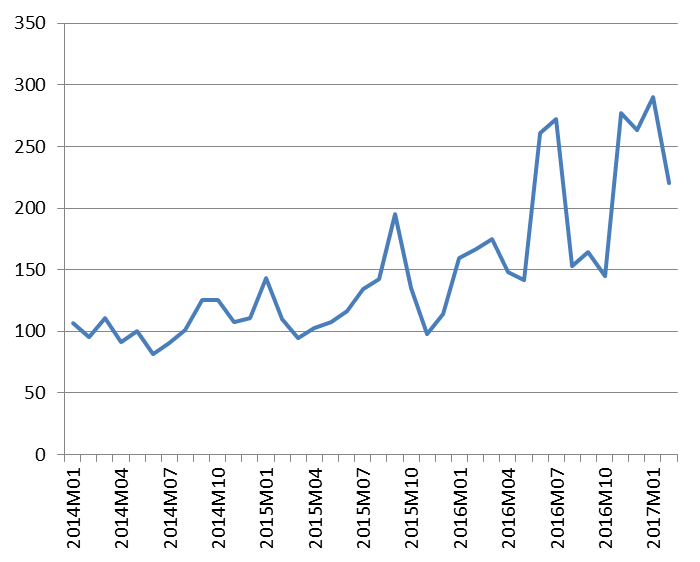
Source: policyuncertainty.com.
Appendix Tables and Charts
Appendix Table 1: World merchandise trade by region and selected economies, 2016
$bn and %
Appendix Table 2: World commercial services trade by region and selected economies, 2016
$bn and %
Appendix Table 3: Leading merchandise exporters and importers, 2016
$bn and %
Appendix Table 4: Leading merchandise exporters and importers excluding intra-EU (28) trade, 2016
$bn and %
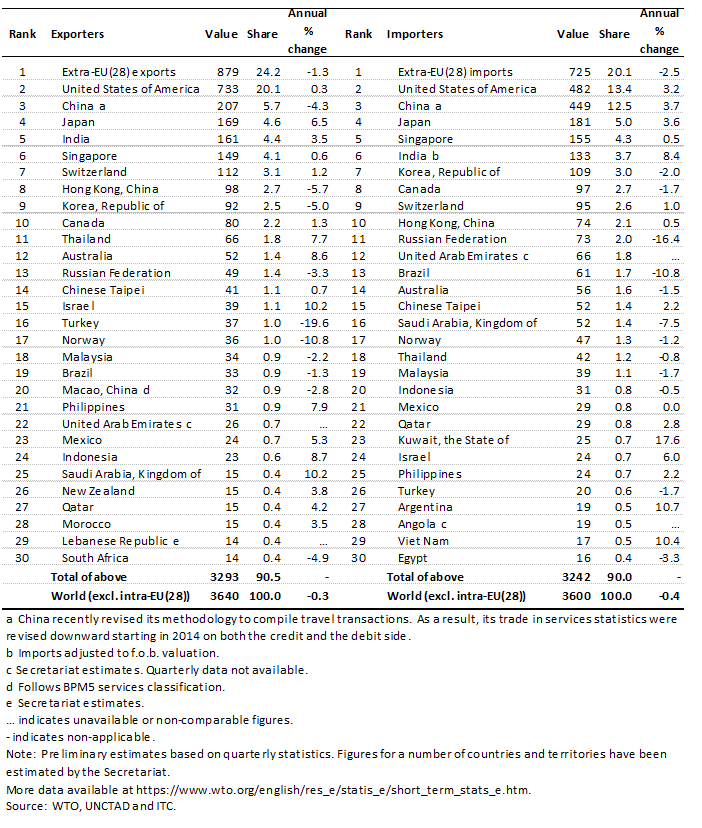
Appendix Table 5: Leading exporters and importers of commercial services, 2016
Appendix Table 6: Leading exporters and importers of commercial services excluding intra-EU (28) trade, 2016
$bn and %
Appendix Chart 1: Contributions to GDP growth of selected economies, 2005-16
% and percentage points
Appendix Chart 2: Merchandise exports and imports of selected economies, January 2015 – February 2017
Year-on-year % change in current dollar values
END

No comments:
Post a Comment