Wednesday, May 31, 2017

SUPPLY CHAIN FIRE FIGHTING

A lot of fire fighting can be a sign of a Supply Chain with process issues.


Tuesday, May 30, 2017

TRUMP BUDGET, POST OFFICE, AND E-COMMERCE

What would be effect of Trump budget for USPS with regards to Post Office's strong role with weekend e-commerce deliveries?


WORLD TRADE FLOWS GROW

World Trade Flows Suggest Strong Economic Growth This Year

The volume of world exports and imports of goods rose by 1.5% in March


Danish shipping and oil giant A.P. Moller-Maersk said container volumes were up 10% in the first quarter.
Danish shipping and oil giant A.P. Moller-Maersk said container volumes were up 10% in the first quarter. Photo: ed jones/Agence France-Presse/Getty Images
World trade flows grew in the first quarter, continuing a recovery that began in the second half of last year in an indication that the global economy may be set to enjoy a year of stronger growth.
World trade flows grew at the slowest pace since the financial crisis in 2016 as a whole, but there are signs 2017 will mark a rebound.
The Netherlands Bureau for Economic Policy Analysis said Wednesday that the volume of world exports and imports of goods rose by 1.5% in March, and was up 1.4% in the first quarter compared with the final quarter of 2016.
The revival in trade flows has also been noted by logistics companies. The International Air Transport Association has reported that demand for airfreight was 11% higher in the first quarter than the same period a year earlier, while Danish shipping and oil giant A.P. Moller-Maersk earlier this month said container volumes were up 10% during the three-month period.
While trade flows are driven by global economic growth, economists have long believed they in turn boost growth, and worried that recent weakness is contributing to the anemic nature of the global expansion.
The sluggishness of trade in 2016 and previous years led many economists to wonder whether changes in the structure of the global economy would weaken growth over the medium term. They noted an increase in barriers to trade other than tariffs and a reversal in the creation of what are known as global value chains, or the process by which large companies moved parts of their production and associated jobs overseas.
More recently, the World Trade Organization has presented research showing trade flows are particularly strong when investment spending is high, linking the postcrisis weakness in spending on plant and equipment to the trade slowdown.
There are signs that investment spending has picked up in 2017, and the WTO forecasts that trade flows will rise by 2.4% this year, and could increase by as much as 4% in 2018.
However, much depends on whether the uneasiness over persistently large trade deficits that have been articulated by U.S. President Donald Trump lead to new barriers to the flow of goods across borders.
Write to Paul Hannon at paul.hannon@wsj.com

OMNICHANNEL -- RETAILERS AND MANUFACTURERS

Should retailers and manufactuers go after costs or a transformed supplychain for omnichannel success?
Go to www.ltdmgmt.com


Friday, May 26, 2017

MAERSK LONG TERM VIEW

Analysis: cut in dividend may sound a warning to APMM investors

Maersk01-132-12-05-2013
The share price of AP Møller Maersk Group has risen by around 40% since last summer, despite no concrete signs, in my opinion, that the corporate restructuring formally announced at the end of September is actually progressing in the right direction.
It is my view that we have heard lots of promises and little else, although these promises need time – years, possibly – before they bear fruit.
However, time is one thing that Maersk has at its disposal, based on its recent financial performance and cash balances, despite the challenging end markets for most of its business lines.
APMM priorities 2017
Source: APMM
There were interesting findings in its latest trading update, which confirm trailing trends.
Waiting game
So here’s a soft warning to all those corporate executives, suppliers and investors who are bullish about organic growth backed by rising rates in the container shipping industry. Many I have talked to are genuinely bullish in their belief that equity and operational risk are manageable within Maersk Line, the main value-driver of the group.
Maersk Line
Source: APMM
But I believe this is a waiting game, until 2020 at the earliest, while the consolidation wave is growing in what is expected to be a record year for M&A in container shipping.
It is important to consider that, if you have followed Maersk’s recent corporate action, you would realise that if its equity value doesn’t hold up at around its current level – or even falls, it will hinder its negotiating power, let alone its ability to use stock as M&A currency in future deal-making.
APMM share price
Source: Yahoo Finance
It used debt to snap up Hamburg Süd in a cash deal that successfully shored up its valuation in recent months, notwithstanding the fact that nobody knows how the deal will play out.
Acquisitions, of course, will continue to be a key component in its corporate strategy following the purchase of its German rival, which recently received the green light from the European Commission – and that means that any mis-steps in corporate strategy could cost it dearly.
Tiptoeing
First-quarter results released this month clearly pointed to improved cash flows on a year-on-year comparable basis, but rising cash flows have not risen enough to cover core investment needs, while cash balances were down significantly, and net debt – up by $1bn since the end of the fourth quarter of last year – continued to soar.
In the first quarter, it churned out more cash from operations than a year ago, while reducing heavy investment by about $600m to $1.2bn, which partly benefited its daily cash-burn rate. Nonetheless, it burned about $4m for every day during the period, based on $376m of negative free cash flow in the first quarter.
Maersk cash flows
Source: APMM
Given the solid bounce in its oil unit, however, there could be a perfect storm ahead if oil prices drop 10-20%, which remains a possibility given the current imbalance between supply and demand, as well as anaemic growth prospects in the consumer sector. Such a base-case scenario could badly hurt the already shaky cash flows, which cannot be mitigated by falling investment forever.
AP Moller Maersk snapshot
Source: APMM
2017, 2018….
In its results presentation, APMM emphasises that 2017 and 2018 are years of transition, but its shares continue to defy the law of gravity – indeed, its current share price seems to suggest there’s no short-term risk here.
But success breeds complacency, and this breeds failure. And in the precarious world of finance, one bad quarter is all that’s needed to change the risk perception towards Maersk and its plan, harming its ability to count on a strong equity valuation, so important when it comes to managing expectations of customers and investors, as was so recently in evidence during the Yang Ming saga.
In Copenhagen, management talked of a “gradual improvement for Maersk Line”, which has problems in steeply rising bunker costs; APM Terminals was described as facing “challenging market conditions”; after a genuine turnaround, Damco’s “forwarding margins are under pressure”; APPM’s drilling operations continue to focus on “costs savings and operational performance”; and, finally, smaller units such as Supply Services, Tankers and Svitzer fared worse than a year earlier.
One bright spot was Maersk Oil, although most of the surge in its reported profit, to $328m (versus a first-quarter 2016 loss of $29m), came as a result of a massive reduction in operating costs, down to $389m in the first quarter from $560m one year earlier, and a one-off benefit in tax income of $24m.
An outlier was Maersk Container Industry (MCI), which enjoyed different dynamics based on its new production capabilities following the full launch of its new factory in Chile, catering for increased demand from third parties for its StarCool reefers and the associated software developed to support the technology. However, the picture MCI offered was generally unchanged from 2016, based on return on invested capital, which is a key gauge of efficient capital deployment.
AP Moller Maersk ROIC FCF
Source: APMM
Paying attention to the whole rather than the parts
APMM’s quarterly results do not warrant a granular look at the financials of each division in isolation, because it is more important to understand how its vast assets base is currently working in unison, given that good and bad assets might have to sit under the same umbrella for quite a long time before a formal separation of transport and energy occurs.
It is possible that Maersk’s management is preoccupied by the possibility of impairments and one-off charges deriving from a formal break-up of the group, which could imbalance its net worth, or equity capital, eventually requiring a cash call to shore up its capital structure. After all, it’s relatively easy to hide losses under its current conglomerate structure, and that could be a reason why it didn’t reach agreement with DONG Energy to merge certain oil and gas assets in the past – although DONG itself appears to be undergoing a strategic transformation.
It is far too early to say if one-off items will prevent a full break-up, but another issue here is the paucity of eager buyers. This is a dreadful market for sellers looking to offload capital-intensive assets to trade buyers, while the public market route is also tricky as investors are wary of the risks associated to committing to any story where cyclicality could sink their returns.
Which, all in all, leads me to think that “New” Maersk could very well end up looking just like “Old” Maersk.
Warnings
Cash balances are falling fast, yet its overall “liquidity reserves”, as Maersk labels cash in hand and certain credit facilities, are reassuring, although uncertainty reigns about its future plans. And one event in particular testifies to a difficult situation where Maersk does not want to commit to sticking to any particular promise – a dividend cut that emerged in early February.
APMM Drawn credit and cash
Source: APMM
“The ordinary dividend of Dkr150 per AP Møller-Mærsk A/S share of nominally Dkr1,000 (in total equal to $454m) declared at the annual general meeting on 28 March, was paid on 31 March,” it said.
A year earlier, Maersk paid out an ordinary dividend of Dkr300.
Back in February 2016, I warned income seekers that dividend risk was apparent through to 2017, and this is now my second warning for investors who want capital appreciation: its stock market value is out of whack with reality, especially considering that capex projections imply heavier investment for the reminder of the year, based on guidance of between $5.5bn and $6.5bn.
AP Moller Maersk Capex
Source: APMM
And that means that increasing pressure on core cash flows is likely.

UPS OFFERS DELIVERY FROM CHINA TO U.S.

UPS has had challenges building its network to handle all the direct to consumer volume.  Adding more consumer delivery volume is interesting.  How much of this is Alibaba?


UPS, China’s S.F. Express Join Forces to Offer Special Delivery Business

Their joint venture will focus on the booming demand for deliveries from mainland China to U.S.

United Parcel Service aircraft in Louisville, Ky., in 2015. UPS is planning to establish a joint venture with the parent of China’s leading package-delivery company, S.F. Express.
United Parcel Service aircraft in Louisville, Ky., in 2015. UPS is planning to establish a joint venture with the parent of China’s leading package-delivery company, S.F. Express. Photo: Reuters
SHANGHAI— United Parcel Service Inc. UPS -0.07% is teaming up with the parent of China’s biggest package-delivery company, S.F. Express, in a bid to tap surging demand for deliveries from China to the U.S.
With Chinese businesses increasingly targeting global markets, chiefly through online sales, UPS aims to help them gain “access to the world,” said Ross McCullough, the company’s president for Asia Pacific.
Under the arrangement revealed by the U.S. company and S.F. Holding Co. on Friday, the 50-50 joint venture will be formally based in Hong Kong, near S.F. Express’s base in Shenzhen. However, their plans call for the business to operate in mainland China, pending regulatory approval. Each partner will commit $5 million in capital to establish the company, according to Mr. McCullough.
An e-commerce boom has fueled the rapid growth of China’s express delivery companies, none more so than S.F. Express, founded by the country’s third-richest man, Wang Wei. The company’s revenue increased by a fifth last year to $8.37 billion, and it recently announced plans to build the world’s biggest airfreight hub in Ezhou in central China.
The Chinese government estimates that the country’s delivery-sector revenue will top $116 billion by 2020, up from $51 billion last year.
Linking UPS’s global and S.F. Express’s local networks will offer Chinese businesses and individuals delivery options “they couldn’t get otherwise,” said Mr. McCullough.
UPS’s business in the country grew 30% in the first quarter, said Mr. McCullough. Its Chinese customers are primarily medium-to-large companies, while S.F. Express is plugged into a vast network of smaller merchants scattered across the country, he said.
“They have a footprint in China that’s amazing; we have a global network they don’t have,” Mr. McCullough said.
The partners would “collaborate to revolutionize the logistics sector,” said Alan Wong, group vice president at S.F. Express.
While UPS is aggressively expanding its own business in China, the tie-up was necessary for the company to capitalize fully on the country’s delivery boom, Mr. McCullough said.
The joint venture will focus initially on China-U.S. deliveries, then add those between the Asian country and Europe at a later date, he said.
Write to Trefor Moss at trefor.moss@wsj.com

Thursday, May 25, 2017

DIGITIZATION AND LOGISTICS

What does digitization mean to the future of logistics intermediaries?


3PL TO 3PSC

3PLs need to transform to 3PSC supply chain service provider that creates ROI which is missing from much outsourcing.


Wednesday, May 24, 2017

COSCO OOCL TAKEOVER

Rumors of COSCO takeover of OOCL.


SUPPLY CHAIN OUTSOURCING ROI

Transform to supply chain service provider creates ROI which is missing from much outsourcing.


LOGISTICS OUTSOURCING MOVING TO INSOURCING

Omnichannel is reversing outsourcing to insourcing. For SCM, need is transforming to supply chain service provider, not logistics.


Tuesday, May 23, 2017

CMA-CGM CHARGES NO SHOWS

CMA-CGM charges for no-show boxes. But what about paying for rolled containers? One-sided "answer".

'Enough is enough' – CMA CGM unveils cancellation fee for no-show boxes

The CMA CGM GEORG FORSTER in Hamburg
CMA CGM will levy a cancellation fee on European shippers and forwarders that do not deliver their containers for booked services to Indian subcontinent, Middle East Gulf and Red Sea ports.
In remarks that echo come of the problems carriers were having with space on the eastbound trades out of Europe, the French carrier said “no-shows” were preventing it serving other shippers.
“CMA CGM has been facing a large number of shortfalls due to late cancellations preventing us from accepting bookings on behalf of other valued customers,” the company said in a statement.
The line says it will apply a $150 per teu cancellation fee on all equipment types, except reefer containers, from 1 June on applications to cancel or transfer a booking made less than seven days before the sailing date.
The fee will also apply to no-shows and will be applied to the party that made the booking – principally freight forwarders.
Container no-shows appear to have become a growing problem for carriers. At the recent TPM show in Long Beach, Hapag-Lloyd chief executive Rolf-Habben Jansen told The Loadstar some 25% of bookings never appear at its ports of loading.
“It becomes very difficult to constantly have conversations with shippers over pricing when you know that a quarter of the containers won’t even show up. That conversation needs instead to become one about quality,” he said at the time.
The no-show issue is also being addressed by the New York Shipping Exchange (NYSHEX), which estimates that no-shows cost the industry $23bn a year in additional costs, and has developed a new contract arrangement for carriers and shippers to arrange ocean freight bookings.

Michael Erlich, professor of finance & economics at New Jersey Institute of Technology, told TPM delegates a lack of “incentives” for buyers and sellers of freight to behave properly was more of “market failure” than simple overcapacity.
“Shippers have a net-positive incentive to ‘downfall’ [no-show] on a booking when offered a lower rate by a competing carrier; while carriers have a net-positive incentive to overbook vessels and either roll the excess bookings with the lowest rates or blank uneconomical sailings,” he said.
Currently NYSHEX is focused on the transpacific trade, but there are plans to expand its service to other trades, starting with Asia-Europe.
In March, NYSHEX received $8.5m in a second round of venture capital funding led by Goldman Sachs.
NYSHEX chief executive Gordon Downes said: “Five of the top ten global ocean carriers are actively engaged on NYSHEX; and leading shippers and forwarders are joining daily. By mid-year we will be fully operational within the transpacific trade and by end of year we intend to be working collaboratively with our members to expand into Asia-Europe.”

Thursday, May 18, 2017

LOGISTICS, TRADE, AND BLOCKCHAIN


Logistics and trade are two ripe areas for blockchain.  Blockchain may come sooner to logistics with right parties involved. It is about money and that brings interest. Connect the product and finance supply chains too.


Wednesday, May 17, 2017

BLOCKCHAIN AND PRODUCT SUPPLY CHAIN AND FINANCE SUPPLY CHAIN

Will product and finance supply chains be integrated for visibility and control? How? Blockchain?  Or?


Tuesday, May 16, 2017

Thursday, May 11, 2017

CHINA TO TRIPLE RAIL FREIGHT WITH EUROPE

May 12, 2017 8:00 am JST

China aims to triple rail freight with Europe by 2020

Link seen as foundation of Belt and Road economic expansion
SHUNSUKE TABETA, Nikkei staff writer

China is expanding rail freight to and from Europe to support more than just its IT industry.
CHONGQING, China -- China aims to nearly triple rail freight shipments to and from Europe by 2020, an international logistics executive here told The Nikkei, making the transport link a backbone of economic growth in the Belt and Road infrastructure initiative.
The National Development and Reform Commission, which steers economic policy, aims to run 5,000 freight trains between China and Europe in 2020, up from 1,800 in 2016.
Toward that goal, China must not only export more to Europe, but work toward economic development with the other countries along the Belt and Road routes, said Zhou Shulin, chairman of the supervisory board at major international shipper Yuxinou (Chongqing) Logistics. Zhou sees railroads as fundamental to that economic development.
Rail freight could bring building materials to Central Asian countries along the Belt and Road route where infrastructure construction is growing, such as Kazakhstan, Zhou suggested.
He added that cross-border e-commerce probably would drive demand for rail shipping as well, as economic growth in Belt and Road countries would let consumers there buy more goods from Chinese companies such as Alibaba Group Holding, raising exports.
China also aims to import more from Europe. There was almost no demand for such imports when the Chongqing railway opened in 2011, but recent years have brought more shipments by rail of European high-end cars and auto parts. Yuxinou is considering bringing in lumber from Russia and northern Europe as well, Zhou said.
He added that he would like to partner with Japanese companies for their cold-storage shipping technology, which could pave the way for importing salmon and other goods from northern Europe.
The railway between Chongqing and Duisburg, Germany, was opened as a major freight artery linking China and Europe. It was meant to export computers, printers and other information technology products, Zhou said. Around a third of the world's computers are made in Chongqing, and most are shipped to Duisburg by train for export to Europe and elsewhere. The railway came to support the growth of the IT industry in China's economy.
The railway became a broader export means for China, the "world's factory," beginning in 2013, when President Xi Jinping introduced the Belt and Road Initiative. It began supporting economic development for other inland areas, such as by shipping coffee beans from Yunnan Province. Shipments of machinery, garments and everyday goods grew, and in 2016, IT products made up only about half of gross shipping volumes.
Yuxinou Logistics was formed in Chongqing by a joint investment from rail operators and logistics companies in countries including China, Germany, Russia and Kazakhstan. It has worked to streamline customs procedures, mainly in China and Germany. It handles distribution by rail freight between Chongqing and Europe, and apparently accounts for about 80% of rail shipping between China and Europe on a value basis. 
Asia300

Alibaba Group Holding Ltd.

China
Market(Ticker):NYS(BABA)
Sector:
Industry:
Retail Trade
Internet Retail
Market cap(USD):292,009.62M
Shares:2,430.17M


FLEXE -- THE AIRBNB OF WAREHOUSES

Adapting logistics to the new reality.

This Startup is the Airbnb of Warehouses and Has Amazon in Its Sights

Flexe finds spare warehouse space for e-commerce merchants, including mattress seller Casper, and is set to offer overnight delivery all over the U.S.
A Seattle startup has come out of nowhere to offer online merchants something even Amazon doesn’t: overnight ground delivery to nearly anyone in the country.
In less than five years, Flexe has created a marketplace of spare storage space in 550 warehouses, quickly establishing better geographic coverage than the vast delivery network that Amazon.com Inc. spent decades and billions building. Flexe did it without spending a nickel on facilities and already has 25 million square feet of storage, about 25 percent of Amazon’s capacity, and expects to add 10 million square feet this year. Merchants book storage space via a simple-to-navigate website; Flexe is essentially the Airbnb of warehousing.
Flexe Co-Founder and CEO Karl Siebrecht
Source: Flexe
The new overnight delivery service, launching Monday, is well-timed because online merchants are looking for new ways to reach customers but have few options that match Amazon’s speed. And because the inventory is stashed all over the country, overnight deliveries can be made by truck rather than plane, which is cheaper. Online brands such as mattress seller Casper also like Flexe because orders flow through their own websites, letting them maintain a direct relationship with customers.
 "You can get goods to your customers as fast or faster than you can through Amazon Prime at a competitive price and it’ll show up in your own branded box rather than an Amazon box," says Flexe co-founder Karl Siebrecht. "That is very important for companies looking to build brands."
The Flexe story begins at a birthday party in Seattle in 2013. Dhruv Agarwal, who owns an online gourmet accessories business called TrueBrands, was kvetching about the challenge of finding warehouse space. His company was growing 30 percent a year, but many warehouse owners demanded a five-year lease, requiring him to take a space that was either way too big or would soon be way too small. Agarwal wondered if he could find spare warehouse space for a few months at a time the same way tourists find a place to crash for a few days on Airbnb.
The Flexe founders were at the party and decided their pal was onto something. They launched that year offering "overflow" services, when retailers and wholesalers needed to stash pallets of inventory for brief periods. Flexe added online order fulfillment last year, giving warehouse operators the option to charge more to pack and ship individual orders directly to shoppers' homes.
The company has raised $20.8 million, including a $14.5 million round last year led by Redpoint Ventures, which invested after hearing from e-commerce companies struggling to line up warehouse space. "Startups don’t know how much space they’ll need because it’s hard to predict where they’ll be in a year or two," said Ryan Sarver, a Redpoint partner. "On-demand warehouse and fulfillment space is a game-changer." Flexe declined to share financial numbers beyond saying sales grew 400 percent last year.
Shoppers' accelerating shift online is straining warehouse space around the U.S., pushing the vacancy rate to the lowest level in 17 years. Flexe is tapping into a shadow inventory of unused space that doesn't show up in the vacancy measure. That space is tied up in long-term contracts, but much of it goes unused for months at a time. Beverage companies and home-improvement stores build warehouses with capacity for the summer months when their business peaks, leaving them with extra space the rest of the year. Warehouses operated by Halloween costume wholesalers empty out just as the holiday shopping season hits and most retailers need more space. Flexe is arbitraging the mismatch between supply and demand, taking a commission for each transaction.
Today, the company has 200 partners. Iron Mountain, which provides document storage for financial, legal, healthcare and government clients, signed on with Flexe two years ago to sell extra space in its 1,000 facilities in 90 markets. Solar panels, space heaters, sheets, pillows and mattresses from various merchants have now passed through its facilities without disrupting the main business, and e-commerce opportunities are growing, says Dale Lawing, an Iron Mountain senior vice president.
Casper uses Flexe to meet demand during summer moving season, says CEO Philip Krim. The company prefers Flexe to Amazon because the latter takes control of the customer experience "Our customers want to buy from Casper and not from Amazon," Krim says. Shoe and apparel brand Toms used Flexe to expand its holiday season pop-up stores beyond the reach of its west coast distribution network. Flexe determined the best locations to help Toms serve three new markets, and Toms was able to secure the space on short-term commitments. The pop-up stores are planned only a few weeks in advance, making it difficult to find warehouse space through traditional long-term leases.
Flexe’s appeal extends beyond startups to brick-and-mortar retailers struggling to compete with Amazon online and brands hesitant to work with a fearsome retail competitor, says Neil Ackerman, a former Amazon executive who runs e-commerce initiatives at Mondelez and sits on Flexe’s advisory board. "Manufacturers, brands and retailers that want to compete with Amazon on delivery without giving up data and the customer experience are all target clients," he says. "Flexe helps them compete with Amazon on delivery without making huge investments in new facilities."
To prosper long-term, Flexe will have to continue expanding its footprint by convincing warehouse operators they can accommodate other businesses on short-term intervals without disrupting their own. And the startup will have to prove itself equal to the challenges of operating during the holiday shopping season when warehouse space is most scarce.
"Being second fiddle in a bunch of warehouses is great 11 months out of the year," says Jarrett Streebin, chief executive officer of EasyPost, which helps retailers coordinate with delivery companies. "But when you consider one month drives most e-commerce sales, that could be a problem."

Tuesday, May 9, 2017

CHINA EXPORTS -- APRIL

China’s Exports Remained Resilient as Global Demand Recovers

China’s overseas shipments held up in April amid recovering global demand and as the threat of a trade war with the U.S. dissipated.

Key Points

  • Exports rose 8 percent in dollar terms from a year earlier, less than the 11.3 percent increase economists projected in Bloomberg survey
  • Imports increased 11.9 percent, compared with an estimate for 18 percent growth
  • Trade surplus widened to $38.05 billion

Big Picture

China’s export outlook has improved on recovering global demand and as the threat of a trade war with its biggest trading partner fizzled. The International Monetary Fund boosted its estimate of global growth this year, brightening the outlook for external demand. Still, both exports and imports missed economists’ estimates, adding to recent evidence that growth may be pulling back after a strong first quarter.

Economist Takeaways

"The latest numbers are consistent with signs of a slowdown from April business surveys," Bloomberg Intelligence economists Tom Orlik and Fielding Chen wrote in a report. "If the peak for 2017 growth is already in the past, China’s space for progress on a challenging deleveraging agenda will be limited. Diminished scope for higher interest rates will also add pressure for yuan weakness."
"The current global demand recovery is fragile and remains susceptible to setbacks," Louis Kuijs, head of Asia economics at Oxford Economics in Hong Kong, wrote in a note. "We expect China’s import growth to continue to ease on slower real estate activity momentum and less accommodative macro policy in China."
"Growth in exports shows robust global demand," said Xia Le, a Hong Kong-based economist at Banco Bilbao Vizcaya Argentaria SA. "China’s financial deleveraging has just started, and will weigh on the domestic economy. Imports will reflect that trend first."
"The broader context for China’s export stabilization is the recovery of global economy," said Tommy Xie, an economist at OCBC Bank in Singapore. "China’s own economy is also off a good start in the first quarter and the momentum seems to have carried onto April."

The Details

  • Shipments to the U.S. climbed 11.7 percent, easing from a 19.7 percent gain in March
  • Exports to the European Union increased 4 percent, the customs agency said Monday
  • Crude Imports slipped from a record to equivalent of 8.4 million barrels per day
  • Coal imports climbed to the highest in four months 
  • Imports of refined copper plunged to the lowest level since October
— With assistance by Miao Han, Xiaoqing Pi, and Kevin Hamlin

Monday, May 8, 2017

LOGISTICS, SUPPLY CHAIN MANAGEMENT, AND KEY TECHNOLOGIES


What is the impact on logistics and on supply chain management?  7 technologies for the next decade!

AI

IoT

Robots

3D printing

Mobile

Autonomous cars and trucks

Internet


LOGISTICS AND BITCOIN

What is the future of paying for logistics services with bitcoin?


Saturday, May 6, 2017

HONG KONG AND THE BELT AND ROAD INITIATIVE


Is the ‘Belt and Road Initiative’ a pipe dream or golden goose for Hong Kong investors?

Breaking down why major Hong Kong businesses have had little to do with China’s go-global trade strategy
PUBLISHED : Saturday, 06 May, 2017, 2:02pm
UPDATED : Saturday, 06 May, 2017, 2:02pm

0Share

Related topics


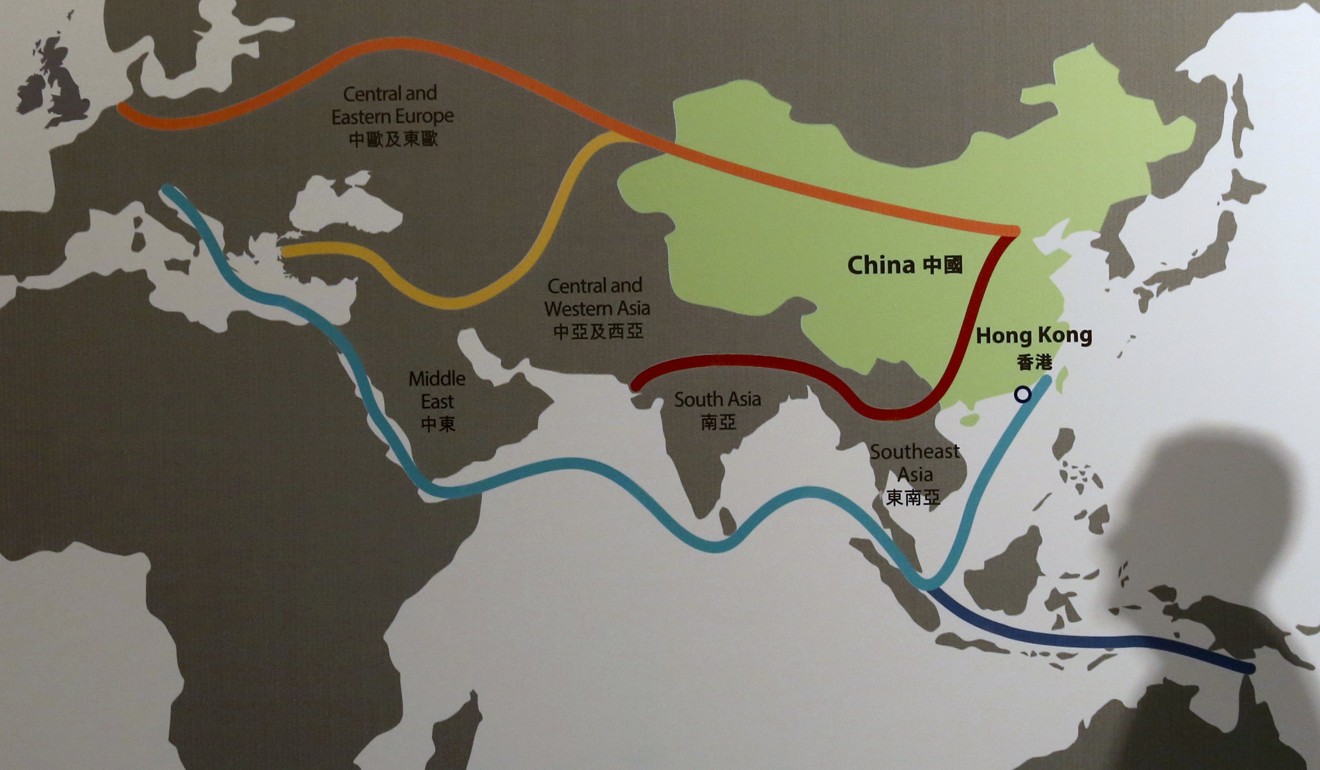
Shortly after Chinese President Xi Jinping announced the “Belt and Road Initiative” in 2013, Hong Kong Chief Executive Leung Chun-ying was quick to embrace China’s go-global trade plan by positioning the city as a “super connector” linking the mainland to more than 60 countries under the scheme.
Leung said Hong Kong’s sophisticated financial system, renowned professional services, and international exposure gave the city an edge in the trade strategy.
But local business communities are wary of the high geopolitical tensions from aligning with the initiative, despite being keen to capitalise on the opportunity. As such, the scheme has seen few investments from the city.
A graphic depiction of the extent of the belt and road plan at the Asian Financial Forum last year. Photo: Reuters, Bobby Yip

In a week’s time, Hong Kong’s business leaders will join the heads of 28 countries, including Russian President Vladimir Putin, in attending a major summit in Beijing to discuss the latest development of the initiative. Where does Hong Kong stand in all this?
Here are the answers:
What has Hong Kong been doing to tap into the initiative?
The Hong Kong government has been taking a leading role in implementing the trade scheme.
It has set up a steering committee chaired by Leung to formulate strategies for the city’s participation, as well as a “Belt and Road Office” to carry out specific tasks.
Hong Kong has also been fighting hard to become the fund-raising centre for projects planned under the initiative, which are expected to require some HK$8 trillion in budget until 2020.
Currently, the government is seeking Legislative Council approval for HK$6 billion to become a member of the Asian Infrastructure ­Investment Bank, the Beijing-led alliance financing the initiative.
The city’s Securities and Futures Commission also said it was willing to be more flexible in approving the listing of initiative-linked companies on the main board, even if they do not meet certain criteria.
The government also provided scholarships to sponsor student exchange programmes in belt and road countries, raising the amount from HK$2.9 million last year to HK$8.2 million in the current fiscal year.
Hong Kong Chief Executive Leung Chun-ying has made efforts to shore up the city’s involvement in the belt and road plan. Photo: Simon Song

How far have Hong Kong businesses gone in terms of investing in belt and road countries?
Despite the promise of the initiative, Hong Kong’s “Big Four” families – who control the city’s most valuable conglomerates comprising real estate, finance, retail and infrastructure – have not taken any action.
They include the families of Li Ka-shing, the city’s richest man and chairman of CK Hutchison Holdings; Kwok Tak-Seng, founder of Sun Hung Kai Properties; Cheng Yu-tung, founder of Chow Tai Fook Jewellery; Lee Shau-kee, chairman of Henderson Land.
For example, countries under the belt and road strategy are largely missing on the global map of Li’s business empire spanning more than 50 countries. Nor has Li recently showed any intention to invest in such countries despite saying in a public address that the city was set to benefit from the Beijing-led initiative.
Why do Hong Kong businesses hesitate from jumping on the investment bandwagon?
A few issues might explain the reluctance of local businesses in putting their money into the plan.
Eddy Li Sau-hung, president of the Chinese Manufacturers’ Association, said trade protectionism in many countries such as India and Indonesia prevented local businesses from striking better deals.
“As a completely free economy, there is a little room for Hong Kong to compromise in exchange for better terms,” Eddy Li said. But he added that the situation might improve with China at the negotiation table.
Despite a large market potential, he also said the buying power of such countries, especially those in central Asia, was still low.
Other industry heads have said that the large gap in trading systems and business cultures between Hong Kong and these countries made navigating the business environment extremely challenging.
When should Hong Kong businesses tap into belt and road countries?
Allan Zeman, the entrepreneur behind the Lan Kwai Fong dining and entertainment district, said Beijing – not Hong Kong – would be the initial driver in negotiations, and some countries preferred to do business with China directly.
“Hong Kong is better at doing business with more established countries,” he said.
But he said that more businesses would tap into the opportunity when infrastructure in these countries matured.
“They are waiting for the right moment. For our own kind of business, it is too early,” he said.
Lan Kwai Fong entrepreneur Allan Zeman says the time is not ripe for Hong Kong businesses to invest in the belt and road strategy. Photo: Nora Tam

What type of opportunities should Hong Kong go into first?
Liao Qun, chief economist at China Citic Bank International, said Hong Kong should be focusing on providing professional services for mainland companies involved in projects in those countries.
He said Hong Kong had historically served as a middleman between China and Western countries, with more than 60 per cent of foreign investments made by mainland companies channelled through the city.

Thursday, May 4, 2017

EXPEDITORS FIRST QUARTER RESULTS

Expeditors Reports First Quarter 2017 EPS of $0.51

           
May 02, 2017
SEATTLE, May 02, 2017 (GLOBE NEWSWIRE) -- Expeditors International of Washington, Inc. (NASDAQ:EXPD) today announced first quarter 2017 financial results including the following highlights compared to the same quarter of 2016:
  • Diluted Net Earnings Attributable to Shareholders per share (EPS1) decreased 4% to $0.51
  • Net Earnings Attributable to Shareholders decreased 3% to $93 million
  • Operating Income decreased 4% to $146 million
  • Revenues increased 9% to $1.5 billion
  • Net Revenues2 increased 2% to $528 million
  • Airfreight tonnage volume increased 16% and ocean container volume increased 7%
“Similar to the past few quarters, our people continued to execute well and we again increased volumes and grew market share,” said Jeffrey S. Musser, President and Chief Executive Officer. “We were especially pleased with the performance of our Transcon and customs brokerage teams, as they increased business with existing customers and also brought on new customers, proving our investments in those areas are bearing fruit. We remain deeply committed to the strategy we have laid out that continues to develop and grow our core business, leading to the purposeful growth in market share that we have been seeing. At the same time, we understand that we must continue to make future investments to remain in the market leading position our customers expect from us in terms of execution and innovation. Technology continues to advance at a rapid pace and we expect to remain at the leading edge of those changes.
“As expected and previously noted, we continued to experience the rate pressure that we have seen in recent quarters. Over the long term, we expect this rate volatility to subside and that we will return to more historical pricing patterns. In the meantime, we continue to refine our processes and carefully execute against our strategy to position our company for further growth.”
Bradley S. Powell, Senior Vice President and Chief Financial Officer, added, “Operating income as a percentage of net revenue was 28%, which is below our 30% operating benchmark, largely due to volume increases being offset by lower average net rates. Employee headcount and operating expenses increased during the quarter, as we continued to invest in people to handle the increases in freight volumes and to develop and deliver improved technology and processes related to our global network. We will continue to make these important investments in people, processes and technology, as well as to invest in our strategic efforts to explore new areas for long-term profitable growth.”
Expeditors is a global logistics company headquartered in Seattle, Washington. The company employs trained professionals in 177 district offices and numerous branch locations located on six continents linked into a seamless worldwide network through an integrated information management system. Services include the consolidation or forwarding of air and ocean freight, customs brokerage, vendor consolidation, cargo insurance, time-definite transportation, order management, warehousing and distribution and customized logistics solutions.
_______________________
1 Diluted earnings attributable to shareholders per share.
2 Non-GAAP measure calculated as revenues less directly related operating expenses attributable to the Company's principal services. See reconciliation on the last page of this release.
NOTE:  See Disclaimer on Forward-Looking Statements on the following page of this release.

Expeditors International of Washington, Inc.
First Quarter 2017 Earnings Release, May 2, 2017
Financial Highlights for the Three months ended March 31, 2017 and 2016 (Unaudited)
(in 000's of US dollars except per share data)
Three months ended March 31,
  2017 2016 %
Change
Revenues $1,545,132  $1,418,472  9%
Net revenues1$527,605  $517,069  2%
Operating income $146,114  $151,826  (4)%
Net earnings attributable to shareholders $93,264  $96,584  (3)%
Diluted earnings attributable to shareholders per share $0.51  $0.53  (4)%
Basic earnings attributable to shareholders per share $0.52  $0.53  (2)%
Diluted weighted average shares outstanding 182,094  183,018   
Basic weighted average shares outstanding 180,062  182,010   
_______________________
1 Non-GAAP measure calculated as revenues less directly related operating expenses attributable to the Company's principal services. See reconciliation on the last page of this release.

During the three-month periods ended March 31, 2017 and 2016, we repurchased 1 million and 1.5 million shares of common stock at an average price of $56.49 and $47.79 per share, respectively.
Employee headcount as of March 31,
  2017 2016
North America 5,902  5,652 
Europe2,887  2,731 
North Asia 2,503  2,457 
Middle East, Africa and India 1,503  1,479 
South Asia 1,414  1,327 
Latin America 777  775 
Information Systems 874  765 
Corporate 362  332 
Total 16,222  15,518 

  Year-over-year percentage increase
(decrease) in:
  Airfreight kilos Ocean freight FEU
2017    
January 10%  15% 
February 17%  (1)% 
March 20%  6% 
Quarter 16%  7% 
_______________________
Investors may submit written questions via e-mail to: investor@expeditors.com. Questions received by the end of business on May 5, 2017 will be considered in management's 8-K “Responses to Selected Questions” expected to be filed on or about May 12, 2017.

Disclaimer on Forward-Looking Statements:
Certain portions of this release contain forward-looking statements which are based on certain assumptions and expectations of future events that are subject to risks and uncertainties, including comments on future margin expectations, ability to adapt to changing business cycles, ability to increase volumes and manage buy and sell rates, quality growth over the long term, expectations for rate volatility and the current rate environment, driving incremental efficiencies in our processes, investing in people and technology, executing our strategic initiatives, and our ability to remain at the forefront of technological innovation. Actual future results and trends may differ materially from historical results or those projected in any forward-looking statements depending on a variety of factors including, but not limited to, the future success of our business model, our ability to maintain consistent and stable operating results, our ability to perpetuate profits, changes in customer demand for Expeditors’ services caused by a general economic slow-down, changes in global trade volumes, customers’ inventory build-up, decreased consumer confidence, volatility in equity markets, energy and fuel prices, geopolitical changes, foreign exchange rates, regulatory actions or changes or the unpredictable acts of competitors and other risks, risk factors and uncertainties detailed in our Annual Report as updated by our reports on Form 10-Q, filed with the Securities and Exchange Commission.
EXPEDITORS INTERNATIONAL OF WASHINGTON, INC.
AND SUBSIDIARIES
 
Condensed Consolidated Balance Sheets
(In thousands, except per share data)
(Unaudited)
 
  March 31,
2017
 December 31,
2016
Assets    
Current Assets:    
Cash and cash equivalents $1,156,043  $974,435 
Accounts receivable, net 1,126,488  1,190,130 
Other current assets 119,265  54,014 
Total current assets 2,401,796  2,218,579 
Property and equipment, net 463,604  536,572 
Goodwill 7,927  7,927 
Other assets, net 29,392  27,793 
  $2,902,719  $2,790,871 
Liabilities and Equity    
Current Liabilities:    
Accounts payable $701,122  $726,571 
Accrued expenses, primarily salaries and related costs 205,255  185,502 
Federal, state and foreign income taxes 20,427  17,858 
Total current liabilities 926,804  929,931 
Deferred Federal and state income taxes 24,195  13,727 
     
Commitments and contingencies    
     
Shareholders’ Equity:    
Preferred stock; none issued    
Common stock, par value $0.01 per share. Issued and outstanding 179,924 shares at March 31,
2017 and 179,857 shares at December 31, 2016
 1,800  1,799 
Additional paid-in capital 4,721  2,642 
Retained earnings 2,038,053  1,944,789 
Accumulated other comprehensive loss (95,678) (104,592)
Total shareholders’ equity 1,948,896  1,844,638 
Noncontrolling interest 2,824  2,575 
Total equity 1,951,720  1,847,213 
  $2,902,719  $2,790,871 


EXPEDITORS INTERNATIONAL OF WASHINGTON, INC.
AND SUBSIDIARIES
 
Condensed Consolidated Statements of Earnings
(In thousands, except per share data)
(Unaudited)
 
  Three months ended
  March 31,
  2017 2016
Revenues:    
Airfreight services $615,545  $560,853 
Ocean freight and ocean services 493,759  454,192 
Customs brokerage and other services 435,828  403,427 
Total revenues 1,545,132  1,418,472 
Operating Expenses:    
Airfreight services 443,404  388,777 
Ocean freight and ocean services 366,063  323,020 
Customs brokerage and other services 208,060  189,606 
Salaries and related costs 292,580  283,355 
Rent and occupancy costs 28,130  26,859 
Depreciation and amortization 11,927  11,329 
Selling and promotion 10,915  9,432 
Other 37,939  34,268 
Total operating expenses 1,399,018  1,266,646 
Operating income 146,114  151,826 
Other Income (Expense):    
Interest income 2,741  2,779 
Other, net 298  879 
Other income (expense), net 3,039  3,658 
Earnings before income taxes 149,153  155,484 
Income tax expense 55,586  58,437 
Net earnings 93,567  97,047 
Less net earnings attributable to the noncontrolling interest 303  463 
Net earnings attributable to shareholders $93,264  $96,584 
Diluted earnings attributable to shareholders per share $0.51  $0.53 
Basic earnings attributable to shareholders per share $0.52  $0.53 
Weighted average diluted shares outstanding 182,094  183,018 
Weighted average basic shares outstanding 180,062  182,010 


EXPEDITORS INTERNATIONAL OF WASHINGTON, INC.
AND SUBSIDIARIES
 
Condensed Consolidated Statements of Cash Flows
(In thousands)
(Unaudited)
 
  Three months ended
  March 31,
  2017 2016
Operating Activities:    
Net earnings $93,567  $97,047 
Adjustments to reconcile net earnings to net cash from operating activities:    
Provision for losses on accounts receivable 931  578 
Deferred income tax expense 5,593  9,896 
Stock compensation expense 10,623  10,831 
Depreciation and amortization 11,927  11,329 
Other, net (351) 36 
Changes in operating assets and liabilities:    
Decrease in accounts receivable 75,454  112,710 
Decrease in accounts payable and accrued expenses (18,324) (15,344)
Increase in income taxes payable, net 19,824  10,925 
Increase in other current assets (3,565) (2,055)
Net cash from operating activities 195,679  235,953 
Investing Activities:    
Purchase of property and equipment (12,761) (14,035)
Other, net (671) (559)
Net cash from investing activities (13,432) (14,594)
Financing Activities:    
Proceeds from issuance of common stock 45,365  41,635 
Repurchases of common stock (53,908) (70,292)
Net cash from financing activities (8,543) (28,657)
Effect of exchange rate changes on cash and cash equivalents 7,904  13,419 
Increase in cash and cash equivalents 181,608  206,121 
Cash and cash equivalents at beginning of period 974,435  807,796 
Cash and cash equivalents at end of period $1,156,043  $1,013,917 
Taxes paid:    
Income taxes $29,146  $37,984 


EXPEDITORS INTERNATIONAL OF WASHINGTON, INC.
AND SUBSIDIARIES
Business Segment Information
(In thousands)
(Unaudited)
 
  UNITED
STATES
 OTHER
NORTH
AMERICA
 LATIN
AMERICA
 NORTH
ASIA
 SOUTH
ASIA
 EUROPE MIDDLE
EAST,
AFRICA

and
INDIA
 ELIMI-
NATIONS
 CONSOLI-
DATED
Three months ended March 31, 2017:                  
Revenues from unaffiliated customers $426,019  59,899  22,103  566,428  147,240  231,457  91,986    1,545,132 
Transfers between geographic areas 24,313  2,639  3,635  5,051  5,431  9,322  4,964  (55,355)  
Total revenues $450,332  62,538  25,738  571,479  152,671  240,779  96,950  (55,355) 1,545,132 
Net revenues $230,785  25,793  14,916  111,833  37,995  75,958  29,731  594  527,605 
Operating income $52,346  5,051  3,451  53,352  13,224  11,646  7,043  1  146,114 
Identifiable assets $1,536,520  106,068  50,344  514,509  122,765  379,853  188,098  4,562  2,902,719 
Capital expenditures $5,242  234  255  1,240  373  5,078  339    12,761 
Depreciation and amortization $7,753  372  320  1,320  531  1,171  460    11,927 
Equity $1,192,601  51,812  27,248  371,152  105,726  118,211  119,627  (34,657) 1,951,720 
Three months ended March 31, 2016:                  
Revenues from unaffiliated customers $407,826  52,106  20,064  497,232  136,418  221,897  82,929    1,418,472 
Transfers between geographic areas 26,034  2,700  3,601  5,096  5,806  10,361  5,394  (58,992)  
Total revenues $433,860  54,806  23,665  502,328  142,224  232,258  88,323  (58,992) 1,418,472 
Net revenues $220,698  27,378  13,733  110,791  39,518  74,541  30,407  3  517,069 
Operating income $48,205  7,291  3,852  55,218  15,691  12,253  9,313  3  151,826 
Identifiable assets $1,236,896  119,258  56,334  455,973  133,940  438,711  216,576  3,852  2,661,540 
Capital expenditures $8,137  311  485  1,085  655  2,119  1,243    14,035 
Depreciation and amortization $7,332  364  253  1,319  512  1,098  451    11,329 
Equity $978,426  79,312  37,325  300,188  115,606  167,726  137,112  (33,184) 1,782,511 
Net Revenues (Non-GAAP measure)
We commonly refer to the term “net revenues” when commenting about our Company and the results of its operations. Net revenues are a Non-GAAP measure calculated as revenues less directly related operations expenses attributable to the Company's principal services. We believe that net revenues are a better measure than are total revenues when analyzing and discussing our effectiveness in managing our principal services since total revenues earned as a freight consolidator must consider the carriers' charges to us for carrying the shipment, whereas revenues earned in other capacities include primarily the commissions and fees earned by us. Net revenue is one of our primary operational and financial measures and demonstrates our ability to concentrate and leverage purchasing power through effective consolidation of shipments from customers utilizing a variety of transportation carriers and optimal routings. Using net revenues also provides a commonality for comparison among various services. The following table presents the calculation of net revenues.
Three months ended March 31,
(in thousands) 2017 2016
Total revenues $1,545,132  $1,418,472 
Expenses:    
Airfreight services 443,404  388,777 
Ocean freight and ocean services 366,063  323,020 
Customs brokerage and other services 208,060  189,606 
Net revenues $527,605  $517,069 
 
CONTACTS:
Jeffrey S. Musser
President and Chief Executive Officer
(206) 674-3433

Bradley S. Powell
Senior Vice President and Chief Financial Officer
(206) 674-3412

Geoffrey Buscher
Director - Investor Relations
(206) 892-4510