
A Slow Fourth Quarter Stagnates the Growth of 3PLs for Fiscal Year 2014
The 3PL market has shown slow growth in the fourth quarter of 2014 mainly because of the declining Euro.
ARC Advisory Group (Logistics Viewpoints) tracks the quarterly revenue results of the most prominent publicly traded 3PLs on an ongoing basis. The report is published after all the companies on the list release their revenues. The off cycle earnings results by some large 3PLs is why we are reporting about 2014 revenues in April.
For this financial analysis, the scope of coverage includes non-asset based transportation and warehousing services (referred to as “contract logistics” in Europe):
The warehousing services business did the best, up 1.4 percent for the fourth quarter and 5.6 percent for the year. International transportation services did the worst, year over year. Full year revenues were up 2.9 percent and fourth quarter revenues increased by 0.1 percent. Domestic transportation services were up in the fourth quarter by 0.6 percent and for the full year by 4.8 percent.
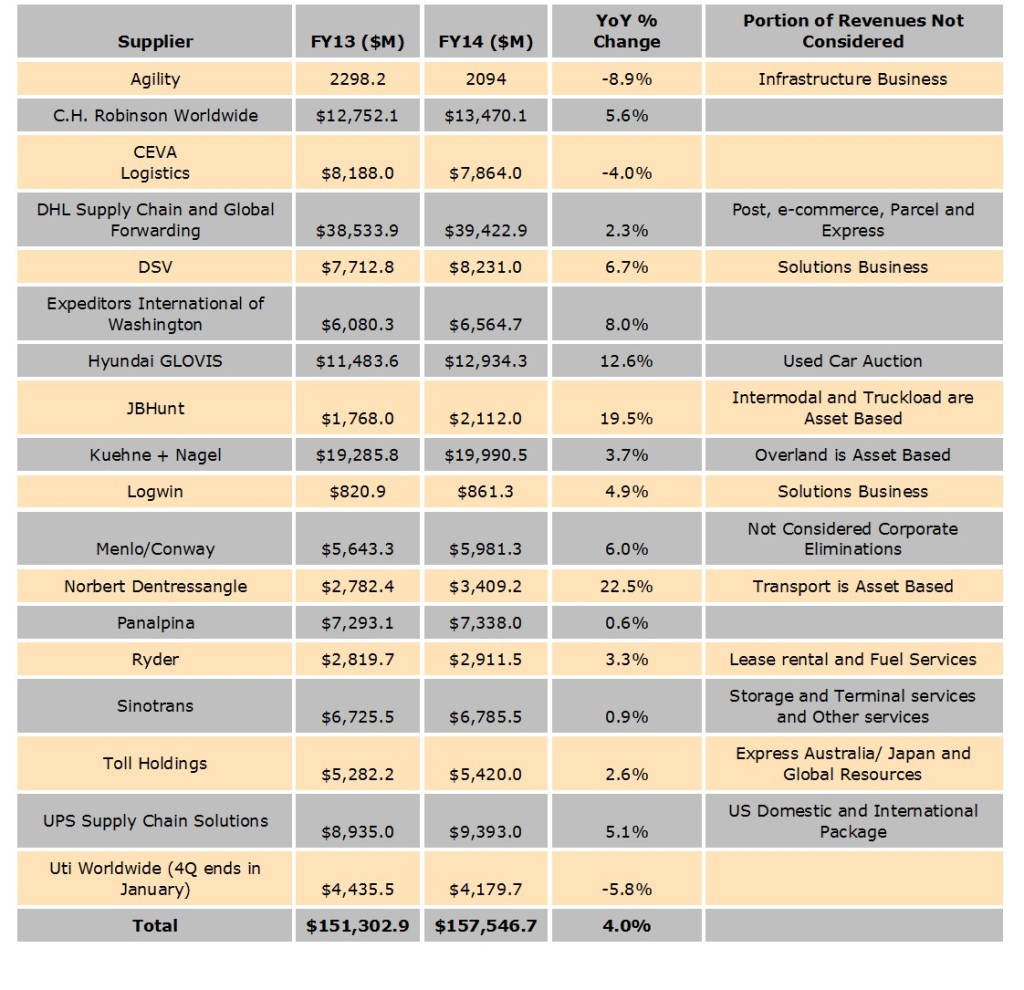
The table below lists the annual performance of the top eighteen publicly traded 3PLS.
ARC Advisory Group (Logistics Viewpoints) tracks the quarterly revenue results of the most prominent publicly traded 3PLs on an ongoing basis. The report is published after all the companies on the list release their revenues. The off cycle earnings results by some large 3PLs is why we are reporting about 2014 revenues in April.
For this financial analysis, the scope of coverage includes non-asset based transportation and warehousing services (referred to as “contract logistics” in Europe):
- Non-asset based domestic transportation services (brokerage and managed transportation services)
- Non-asset based international transportation services (freight for-warding and customs services)
- Warehousing services (warehousing and associated services such as packaging, light assembly, sequencing goods for a factory line)
- Norbert Dentressangle, up 22.5 percent
- JBHunt, up 19.5 percent
- Hyandai GLOVIS, up 12.6 percent
- Expeditors International of Washington, up 8 percent
- DSV, up 6.7 percent
- Agility, down 8.9 percent
- Uti Worldwide (4Q ends in January), down 5.8 percent
- CEVA Logistics, down 4 percent
The warehousing services business did the best, up 1.4 percent for the fourth quarter and 5.6 percent for the year. International transportation services did the worst, year over year. Full year revenues were up 2.9 percent and fourth quarter revenues increased by 0.1 percent. Domestic transportation services were up in the fourth quarter by 0.6 percent and for the full year by 4.8 percent.
The table below lists the annual performance of the top eighteen publicly traded 3PLS.

If you would like a complete copy of this analysis, including the results of the eighteen 3PLs covered, please contact chanf@arcweb.com.
No comments:
Post a Comment